
The March 2013 Federal Reserve's Industrial Production & Capacity Utilization report shows a monthly increase of 0.4% in industrial production. March's increase would have been non-existent if the weather hadn't turned cold. Utilities' output increased 3.5% for March as mining fell -0.2% and Manufacturing dropped -0.1% for the month. February was revised up to a 1.1% increase, buoyed again by utilities. Q1 2013 gives an annualized output gain of 5.0%, the largest since Q1 2012. The Q1 output gain was spurred by utilities, which by itself grew 10.5% for Q1 2013. The G.17 industrial production statistical release is also known as output for factories and mines.
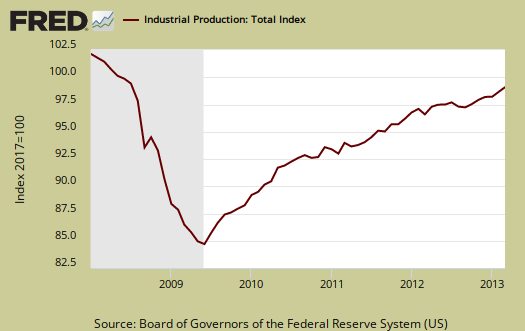
Total industrial production has increased 3.5% from March 2012 and is still down -0.5% from 2007 levels, going on past an incredible five years. Here are the major industry groups industrial production percentage changes from a year ago.
- Manufacturing: +2.5%
- Mining: +3.8%
- Utilities: +10.5%
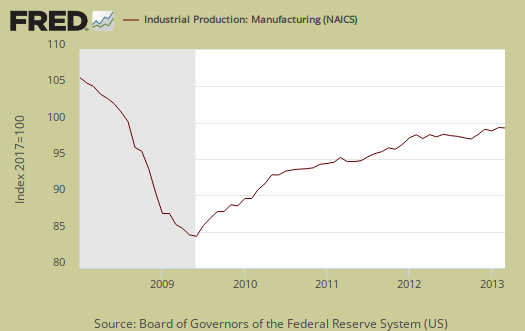
Manufacturing alone dropped -0.1% for March, but was revised to 0.9% for February. Q1 2013 has an 5.3% annualized percent change for manufacturing overall. Below is a graph of just the manufacturing portion of industrial production.
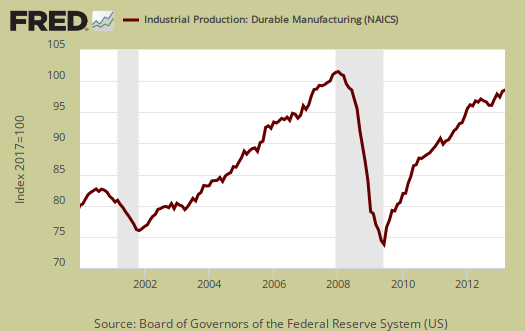
Durable goods declined by -0.2% for March and output dropped across the board, In February durable goods increased 1.6% and for Q1 2013, durable goods has grown by 6.5%, with increases in every major category.
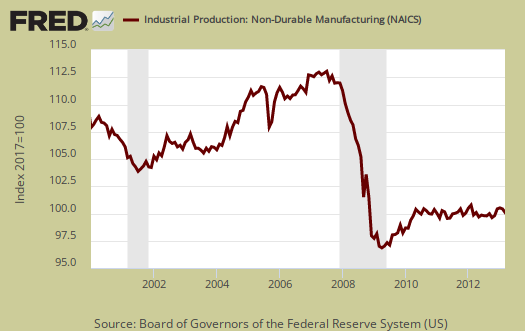
Nondurable goods manufacturing had no change for the month, but for Q1 2013 increased by an annualized 4.7%. This is the largest quarterly increase since Q1 2005. Below is a graph of nondurable goods by industry.
There are two reporting methodologies in the industrial production statistical release, market groups and industry groups. Market groups is output bundled together by market categories, such as business equipment or consumer goods. Industrial output is by NAICS codes and is for all manufacturing, or all types of durable goods manufacturing*. Below is the Fed's description of Market groups from the report and their monthly percent changes. The thing to notice is how defense and space declined 5.5% annualized for Q1 2013. It is safe to blame the sequester on that one.
The production of consumer goods advanced 1.1 percent in March. For the first quarter, the output of consumer goods moved up at an annual rate of 6.2 percent, its largest quarterly increase since the end of 1999. In March, the production of durable consumer goods rose 0.8 percent, primarily as a result of a large increase in the output of automotive products. The index for home electronics also rose, but the indexes for appliances, furniture, and carpeting and for miscellaneous goods declined. The output of consumer durables jumped at an annual rate of 12.0 percent in the first quarter following a gain of 9.3 percent in the fourth quarter of 2012. The production of nondurable consumer goods advanced 1.2 percent in March because of strength in consumer energy products. The index for non-energy nondurable consumer goods was unchanged, as an increase in the index for chemical products was offset by decreases in the indexes for foods and tobacco, for clothing, and for paper products. For the first quarter, the output of consumer nondurables rose at an annual rate of 4.6 percent.
The production of business equipment edged up 0.1 percent in March after having risen 1.9 percent in February; the index increased at an annual rate of 3.8 percent in the first quarter. In March, a large gain in the output of transit equipment and a small rise in the output of industrial and other equipment were mostly offset by a reduction in the output of information processing equipment. For the first quarter, however, transit equipment recorded its first decrease since the initial quarter of 2011, while the other two categories of business equipment posted solid gains.
The index for defense and space equipment decreased 0.2 percent in March after having been unchanged in February. The output of this category fell 5.5 percent at an annual rate in the first quarter.
Among nonindustrial supplies, the production of construction supplies fell back 1.3 percent in March following four months of solid gains; the output for this market group advanced at an annual rate of 15.0 percent in the first quarter following a gain of 7.2 percent in the previous quarter. Although the index has recovered considerably since its trough in December 2009, the output of construction supplies in March stood nearly 20 percent below its levels during 2007 prior to the recession. The index for business supplies moved up 0.6 percent in March and rose at an annual rate of 4.6 percent in the first quarter.
The output of materials to be processed further in the industrial sector rose 0.2 percent in March because of an increase of 1.3 percent in the output of energy materials; the index for non-energy materials declined 0.4 percent, with losses in almost all of its major categories. The index for durable materials was down 0.7 percent in March, its first decrease since September 2012, but output in the first quarter increased at an annual rate of 6.6 percent. The indexes for each of the three major categories of durable materials decreased in March but posted solid gains for the first quarter. The output of nondurable materials edged down 0.1 percent in March, as declines in paper and chemical materials outweighed strength in textile materials and other nondurable materials. For the first quarter, however, the production of nondurable materials rose at an annual rate of 4.1 percent with improvements in all of its major components. The output of energy materials gained 1.3 percent in March after having risen 1.0 percent in February; the index posted its eighth consecutive quarterly increase in the first quarter.
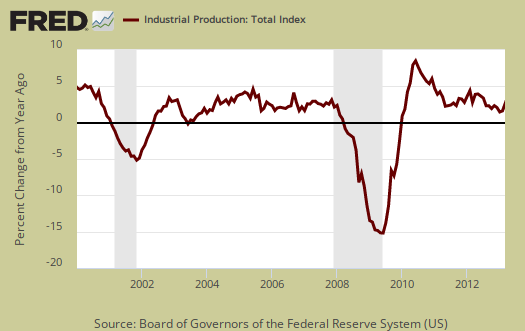
Below is graph of overall industrial production's percent change from a year ago. The Federal Reserve gives long term averages but economic malaise has been going on so long, 2008-2012 are part of those averages now.
Capacity utilization, or of raw capacity, how much is being used, for total industry is 78.5%, now 1.7 percentage points below the average from 1972 to 2012. Capacity utilization has increased 1.2 percentage points from a year ago. Manufacturing capacity utilization declined 0.2 percent points for the month. Manufacturing capacity utilization, 76.4%, is now 1.6 percentage points above the 75.7% level a year ago.
Capacity utilization for durable goods declined -0.3 percentage points for March and is now 76.4%, which is 0.6 percentage points below the long run average. Nondurable goods, on the other hand, declined 0.1 percentage point for the month and is still 2.9 percentage points below it's long run average. Nondurable goods capacity utilization now stands at 77.8%.
Utility capacity utilization jumped 4.2 percentage points for March to 82.9%. Mining capacity decreased 0.4 percentage points, to 87.5%. Capacity utilization is how much can we make vs. how much are we currently using, of what capacity is available now, or output rate. Capacity utilization is industrial production divided by raw capacity.

Capacity growth is raw capacity and not to be confused what what is being utilized. Instead, this is the actual growth or potential to produce. Capacity is the overall level of plants, production facilities, and ability to make stuff, that we currently have in the United States. Think about a new factory being built, or a factory shut down and it's machinery sold at auction and shipped to China. This is capacity. Capacity growth overall has increased 1.9 percentage points from March 2012. Below is the capacity growth increase from a year ago of the subcategories which make up industrial production.
- Manufacturing: +1.6%
- Mining: +4.2%
- Utilities: +1.5%
According to the report for 2012, manufacturing uses 77.4% of capacity, with durables about 39.7%. Utilities use 9.9% and mining 12.7% in 2012 (rounded) to give a ratio of manufacturing vs. mining and utilities in terms of capacity. High tech uses 3.7% of total industrial production capacity. Below is the Manufacturing capacity utilization graph, normalized to 2007 raw capacity levels, going back to the 1990's. Too often the focus is on the monthly percent change, so it's important to compare capacity utilization to pre-recession levels and also when the economy was more humming.

Here are our previous overviews, only graphs revised. The Federal Reserve releases detailed tables for more data, metrics not mentioned in this overview. If you are baffled by what crude, finished mean from the G.17 report, read these stages of production definitions. Stages of production have implications for exports and imports. Finishing industrial production implies goods for final sale and thus what kind of output one will see for the month. From the report:
Capacity utilization rates in March at industries grouped by stage of process were as follows: At the crude stage, utilization declined 0.4 percentage point to 86.2 percent, a rate 0.1 percentage point below its long-run average; at the primary and semifinished stages, utilization rose 0.6 percentage point to 77.5 percent, a rate 3.5 percentage points below its long-run average; and at the finished stage, utilization was unchanged at 76.2 percent, a rate 0.9 percentage point below its long-run average.
*From the Federal Reserve definition details:
Market groups consist of products and materials. Total products are the aggregate of final products, such as consumer goods and equipment, and nonindustrial supplies (which are inputs to nonindustrial sectors). Materials are inputs in the manufacture of products. Major industry groups include three-digit NAICS industries and aggregates of these industries-for example, durable and nondurable manufacturing, mining, and utilities./blockquote>
G 17 discrepancy?
the manufacturing index is at 95.7, up from 95.3 in December, yet the opening paragraph says "the index advanced at an annual rate of 5.3 percent in the first quarter"
that does not compute..
rjs
G.17, no discrepency, annualized vs. percentages
Manufacturing monthly index, in order
Q4 Q1
93.2 94.5 95.3 | 95.0 95.9 95.7
Percent Change formula:
((x(t)/x(t-1)) - 1) * 100
Annualized Formula (annualized is what it looks like if that quarterly change happened for the entire year).
(((x(t)/x(t-1)) ** (n_obs_per_yr)) - 1) * 100
To get Quarterly from Monthly is the average of the three months.
Q4 = 94.33
Q1 = 95.53
Q1.Q4 % change = 1.3%
Annualized, using the above formula, is 5.2%
((95.53/94.33)^4 - 1) * 100
^4 means raised to the power of 4 or "times itself 4 times"
x*x*x*x
The Fed uses more resolution on indexes so I imagine the 5.3% vs. 5.2% is just rounding error on the published indexes in the report.
I've chased down weird fed math many a time, and in their flow of funds, consumer credit they truncate instead of round but I can usually match their calculations so I'll assume this one is just more rounding error.
Gov. stats are tricky for they mix and muddle percentages, annualizations and so on.
what i didnt do..
"To get Quarterly from Monthly is the average of the three months."
i took growth from the end of the 4th quarter to the end of the 1st quarter to the 4th power and ended up with an annualized growth rate around 1.7%
i see your explanation of what the Fed did there but it still seems counterintuitive to me...
rjs
some math on annualized
Alternatively one can take the three month sum for quarterly. Because it is a ratio, the "3" or average cancels each other out. (x/3 / y/3) = x/y
If you take just one month as a ratio to another month, then you must annualize it to the right power, in that case 12. So, you should get 5.15%, i.e. 5.2% annualized.
Annualized just means what is the change if the percentage change per quarter happened for an entire year?
So, the quarterly percent change is 286.6/283 -1 *100 = 1.27%
1.3% *4 = 5.2%
In other words, if the percent change per month or per quarter happened every quarter for that year, what would the annual growth be?
And with rounding the Fed is saying manufacturing output would then grow by 5.3% from October 2012 to October 2013 (Q4 to Q4) if the change between 2012 Q4 to Q1 2013 holds up at the same rate (which it won't).
The only weirdness here to me is the Fed reporting 5.3% annualized growth when I get 5.2%, but odds are that's rounding for they use spreadsheets, programs when running these figures with their own internal numbers and many significant digits of indexes that are not published.