Consumer prices in December fell ( -1.0 %) non-seasonally adjusted. Inflation for the entire year 2008 was 0,1%! (meaning I have officially won my bet wtih Bonddad). In the first seven months of the year, driven by soaring gas prices, inflation surged 4.6%. And then the deflationary bust hit. In the last 5 months, prices have fallen ( - 4.4 %), or at an annual rate of ( - 11.0%). Here is how our Deflationary Recession compares with others from the past 100 years, as of year end 2008:
Recession dates/ YoY, monthly deflation/greatest +/- change
| Recession Time Period | -1.5% Deflation | Largest Change |
|---|---|---|
| 1/13 - 12/14 | 2 - 4/14 | (-3.0%) |
| 8/18 - 3/19 | n/a (inflationary) | +23.7% |
| 1/20 - 7/21 | 8/20 - 9/22 | (-15.8%) |
| 5/23 - 7/24 | 4/24 | (-1.8%) |
| 10/26 - 11/27 | 1 - 5, 8/27 | (-3.4%) |
| n/a | 6/28 | (-2.8%) |
| 8/29 - 3/33 | 4/29, 3/30 - 8/33 | (-10.7%) |
| 5/37 - 6/38 | 1 - 12/38 | (-3.4%) |
| 2/45 - 10/45 | n/a (inflationary) | +2.8% |
| 1/49 - 10/49 | 1/49 - 1/50 | (-3.2%) |
| 7/53 - 5/54 | n/a | (-.8%) | 12/07 - ???? | 10/08 - ???? | (- 4.4 %) |
There have only been two occasions in the past 100 years when there was a deeper deflationary spiral: the post-WW1 recession of 1920-1, and the Great Depression.
Additionally, contrary to the prediction of many pundits, food price inflation also continues to abate, albeit slightly at ( - 0.1%) in December.
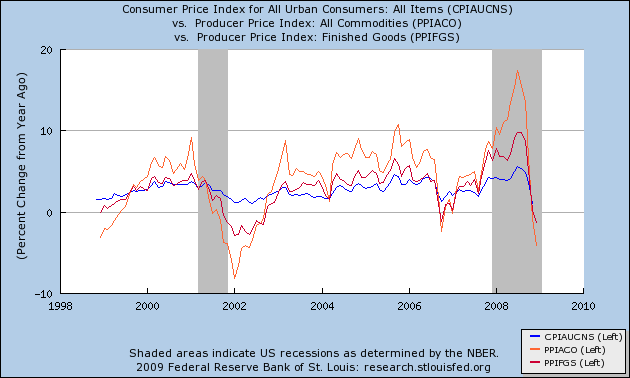
Deflation is occurring at all stages of production. Producer prices (red) and crude goods prices (orange) continue to falling at a faster rate than Consumer inflation. Both crude goods and Producer price DEflation on a YoY basis exceed Consumer DEflation:

This was the normal pattern in all post-WW2 recessions, and signified that the recession was in its latter stage, or even was ending.
This time something worse is happening. We are on the cusp of a deflationary wage spiral as well. According to the Los Angeles Times, for the first time since the Great Depression:
Broad-based pay cuts, long frowned upon, are being imposed by a growing number of companies big and small....
FedEx Corp. cut wages for 36,000 salaried workers by 5% last month; at construction equipment maker Caterpillar, many employees will see their pay reduced by as much as 15%. Gymboree Corp., the San Francisco-based children's clothing retailer, is cutting senior executives' salaries by up to 15% and the pay of some other staffers by as much as 10%.
Union workers at YRC Worldwide Inc., the nation's biggest trucking company, voted last week to accept an across-the-board 10% pay cut to help their employer weather the slump in freight traffic.
At the Newport Beach office of MBH Architects, salaries for partners and many professional staff were slashed 25% to 50% as clients canceled projects and billings fell off a cliff.
...[E]xperts say it is a sign that some employers are resorting to exceptional measures to deal with the crumbling economy.
For all of those who thought deflation would be good, the above is your answer.
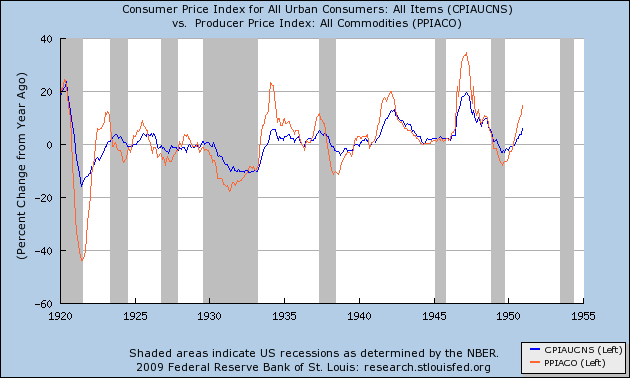
And if you want to be even more frightened, look at the graph of consumer prices (blue) vs. producer raw commodity prices (orange) during the deflationary Roaring 20s and Great Depression period:

This graph is the one that really scares me. Of the 7 deflationary recessions between 1920 and 1950, in 5 of them - including the Great Depression - commodity prices (orange) declined, and declined faster than consumer prices (blue) from the very start of the recession.
I will have a lot more to say about this in the next week or two. For now, take away this point: we will almost certainly know in the next 60-90 days whether or not we are starting the first full-fledged deflationary wage-price spiral in over 70 years. If that happens, it will make the entire crisis up until now feel like a walk in the park.

Comments
wage-price
Having wages fall is precisely what the U.S. does not need right now. We have been in wage repression since 1980, with a blip during the dot con era.
When you say the Great Depression is worse, you have our yearly deflation numbers at 11% and the Great Depression time period at 10.7%. Is this an error or am I misreading something.
Hey you should give the great Bonddad a link over to his blog as the consolation prize for winning the bet.
I think also taking a look at Dr. Doom Roubini's numbers is worth something. He is predicting a total 5% GDP decline for 2009 (this is in reference to your previous post on mild, meek recovery).
Shame it's not Halloween for scary monster graph and why it is horrifying could at least have some gallows humor. [sic]