
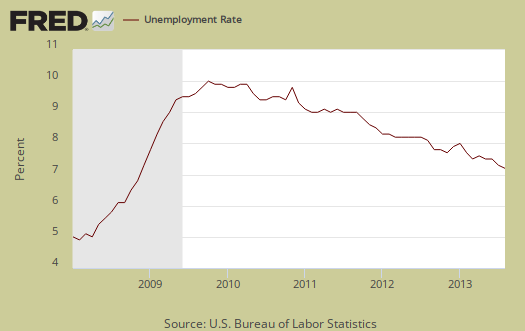
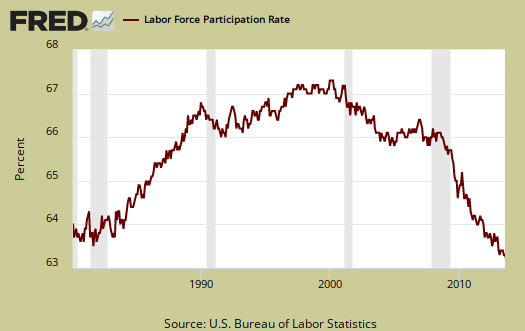
The BLS employment report shows the official unemployment rate declined a percentage point to 7.3% as over half a million people dropped out of the labor force. The labor participation rate just hit a low not seen since August 1978. Less people were employed as well. People dropping out of the labor force is no way to lower an unemployment rate, yet this is what is going on, five years eight months after the start of the Great Recession. This article overviews and graphs the statistics from the Current Population Survey of the employment report.
The labor participation rate is now 63.2%, mentioned above. The labor participation rate has declined -0.3 percentage points from a year ago. This implies that those who were dropped from the labor force are staying out of the labor force The -0.3 percentage points represents about 740 thousand people. For those claiming the low labor participation rate is just people retired, we proved that false by analyzing labor participation rates by age.
The number of employed people now numbers 144,170,000, a -115,000 monthly decline. We describe here why you shouldn't use the CPS figures on a month to month basis to determine actual job growth. These are people employed, not actual jobs. In terms of labor flows, those employed has increased two million from a year ago. The noninstitutional population has also increased by 2.393 million during the same time period, so this is actually a good sign that people employed did really increase over the past year. The statistics from the CPS do generally vary widely from month to month, yet two million more employed per annum is still not enough to correct the jobs crisis in America. Below is a graph of the Current Population Survey employed.

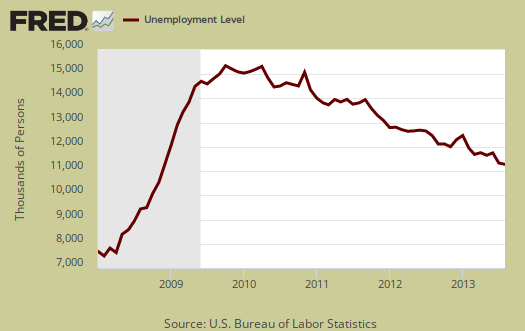
Those unemployed stands at 11,316,000, a -198 thousand decrease from last month. From a year ago those officially unemployed has declined by 1,167,000. This isn't a great showing, especially considering the low labor participation rate and also implies about a million of those getting the jobs might be new entrants into the labor force, such as foreign workers Tthe United States counts foreign guest workers in their employment statistics. This also means many people simply fell off of the BLS radar screen for being counted at all and are considered instead not in the labor force. Below is the change in unemployed and as we can see, this number also swings wildly on a month to month basis.

The number of people counted as unemployed has also remained fairly static for years In terms of labor flows we don't see much slope, or change in the number of unemployed. Below is a graph of the unemployed.
Below is a graph of those considered employed, in maroon, scale on left, against those considered unemployed, in blue, scale on right, by the BLS methods. It is only recently that the growth rate of the employed has exceeded the growth rate of the unemployed (the maroon line exceeding the blue line).

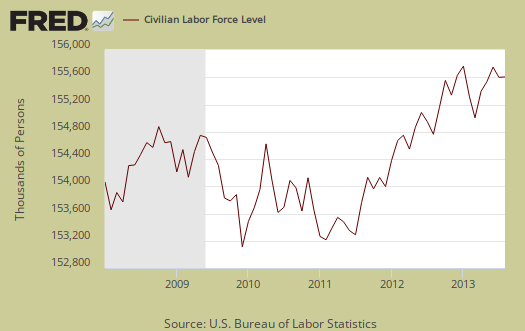
The civilian labor force, which consists of the employed and the officially unemployed, is now at 155,486,000. This is a decline of -312 thousand from last month, as the ranks of both of the employed and unemployed dropped. The BLS gives reason for unemployment and those who lost their jobs this month increased by 49 thousand yet those who voluntarily left their job declined by -86 thousand. People reentering the labor market also declined by -129 thousand and new people into the labor market increasedd by 45 thousand. What this means is less people reentered the job market and less people quit their jobs. Both of these figures imply a piss poor labor market for workers. .
Notice in the civilian labor force graph below how many more people are in the labor force than at the start of the 2008 recession. Population increases every month and this post gives details on that increase, while this one describes BLS labor concepts as well as how many jobs are needed just to keep up with the increased population.
It's fairly clear the American workforce is ending up not being counted. Those not in the labor force now tallies to 90,473,000, an increase of 516,000 from last month. From a year ago, those considered not in the labor force has grown by 1.554 million. Below is the change to show on a month to month basis, the CPS shows quite a bit of variance. We talk about the wild monthly CPS changes in this post.
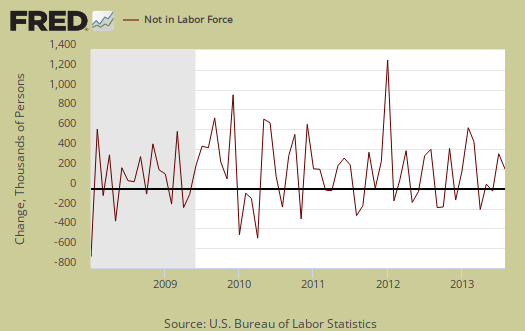
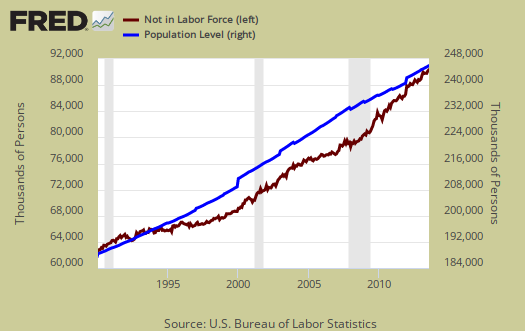
Yet in spite of the wild swings, as a slope, or rate of increase, those not in the labor force grew faster than the population that has the potential to work. Below is a graph of those not in the labor force, (maroon, scale on the left), against the noninstitutional civilian population (blue, scale on the right). Notice how those not in the labor force crosses the noninstitutional civilian population in growth and the accelerated growth started happening right in 2008. This cannot possibly be retirees, all at once and instead a segment of those not in the labor force simply do need work and are not being counted in the official unemployment statistics.
Below is a graph of the civilian labor force, in maroon, scale on left, against those not in the labor force, in blue, scale on right. Notice how those not in the labor force as a trend exceeded those considered employed and unemployed since 2008. It is only recently, in the past few months, where we see the reverse by trend lines, which is a good thing. What we have seen is a never ending growing segment of the population that is considered neither employed or unemployed, i.e. not in the labor force, increasing, above the trend line of those who would be naturally dropping out, such as the retired and those in school. Not in the labor force figures do include retirees.

Those considered employed as a ratio to the total Civilian noninstitutional population stands at 58.6%, a decline of -0.1 percentage point. This ratio hasn't been hovering around 1983 record lows for years now and in 1983 there were more families with a stay at home mom. The low ratio implies there are many people who could be part of the labor force who are not anymore, as shown in the graph below.

Another horrific characteristic of today's labor market is the gross number of working part-time generally. There are millions of people who need full-time jobs with benefits who can't get decent career oriented positions. Those forced into part time work is now 7,911,000, an decrease of -334,000 from last month. While this might look like better news, it is not. Those stuck in part-time has only declined by 132 thousand from a year ago,
There are two categories of those working part-time hours. Those who could only get part-time jobs and those working who got their hours cut due to businesses not having enough work for them. The number of people who could only get part-time work increased 54 thousand to 2,719,000. We're seeing a dramatic increase of people who could only get part-time when they want full-time and this has not happened since the early 80's as shown in the graph below.

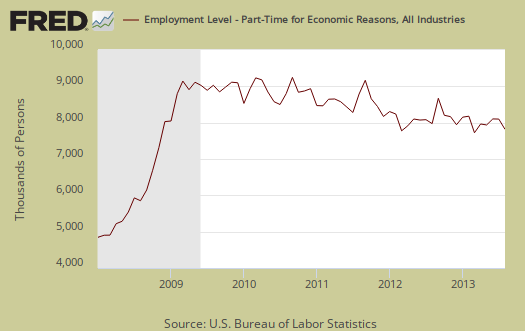
Below is a graph of forced into part-time work because they got their hours cut, as a percentage of the total employed. Part-time work due to cut hours is known as slack work conditions and consisted of 4,808,000 people, a decline of -369,000 from last month. While slack working conditions is still amazingly high, this is one of the few bright spots from this month for it implies economic conditions have improved. Below is a graph of forced part-timers due to slack work conditions as a percentage of the civilian labor force. This is a recession economic indicator. Notice the line slope matches strongly the gray recession bars of the graph.

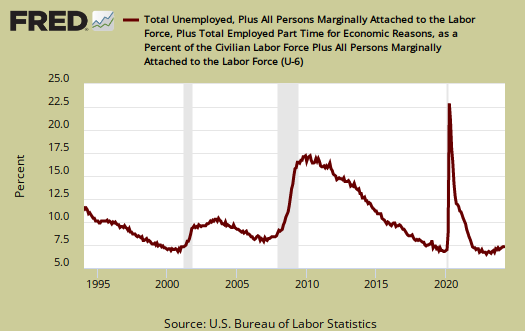
U-6 is a broader measure of unemployment and includes the official unemployed, people working part-time hours because that's all they can get and a subgroup not counted in the labor force but are available for work and looked in the last 12 months. Believe this or not, the U-6 alternative unemployment rate still leaves out some people wanting a job who are not considered part of the labor force. U-6 dropped -0.3 percentage points to 13.7%. This month's drop in the U-6 figurewas due to the official unemployment rate decline and the drop in those forced to work only part-time.
The long term unemployed, or those unemployed for 27 weeks and over, stands at4,290,000 people. This is an increase of 44,000 from last month. The long term unemployed are the crisis of our time and this figure decrease does not necessarily imply those unemployed for a long time are actually finding jobs. The long term unemployed have declined by -733 thousand from a year ago, yet we believe this is due to people no longer counted versus all of those thousands finding work

The marginally attached are people not in the labor force because they have not looked for a job in the last month, but have looked for a job in the last year. This number has ballooned since 2007 and not returned to pre-recession levels. The graph below is the number of people considered marginally attached to the labor force, currently at 2.342 million. Those marginally attached has declined by -219 thousand from a year ago.
Discouraged workers are people, not counted as part of the civilian labor force, who not only want a job, but also looked for one in the last year. These people aren't job hunting now because they believe there are no jobs out there. Below is the graph of discouraged workers, currently at 866,000 people and are a subset of the marginally attached. Discouraged workers is kind of a barometer for how the job market is perceived and has increased by 22,000 people from a year ago.

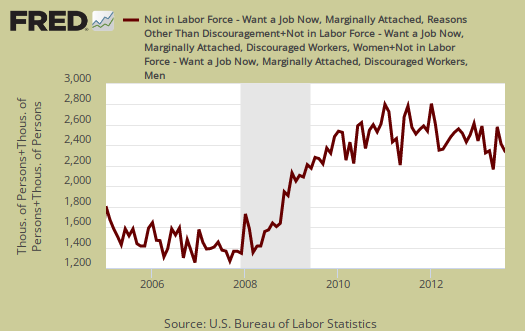
OUr favorite statistic from the CPS survey is how many people who are considered not in the labor force, report they want a job now. It is a direct survey question from the CPS. The survey asks people who are not being counted in the unemployment statistics and official unemployment rate if they want a job. The number who answer yes currently stands at 6,285,000. A year ago this figure was 6,956,000. While this figure has decreased, there are an astounding number of people not counted who report they actually want a job and roughly 2.2 million higher than before the recession. This figure includes the discouraged workers and marginally attached, but is seasonally adjusted, unlike the above.

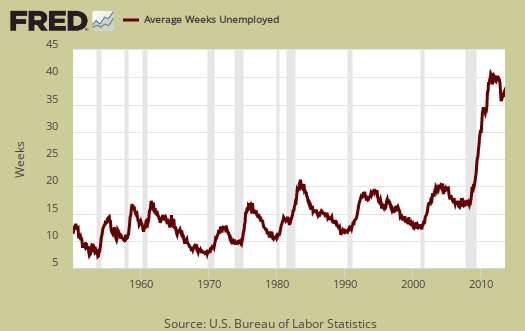
The average length of unemployment is now 37.0 weeks, a 0.4 increase from last month and this figure has been increasing . The average duration is also so high due to the long-term unemployed who represent 38% of the unemployed. Many face age discrimination as well as discrimination for the fact they need a job, one of the worst injustices in America.
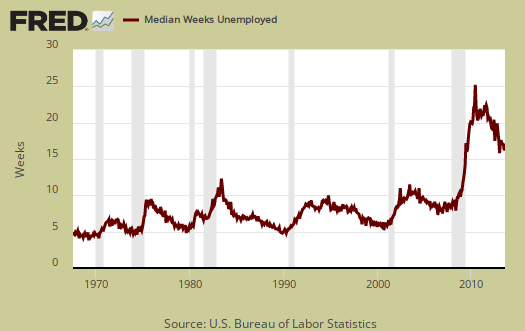
The median time one is unemployed, which means 50% of people have gotten a job in this amount of time, and is 16.4 weeks, an increase of 0.7 weeks from last month.
Those unemployed less than five weeks saw no change from last month. Those unemployed between five weeks and 14 weeks decreased by -103 thousand and people who had been unemployed for 14 weeks to 26 weeks decreased by -94,000. As previously noted, the long term unemployed increased by 44 thousand. . A drop in the unemployed does not necessarily mean they found a job.
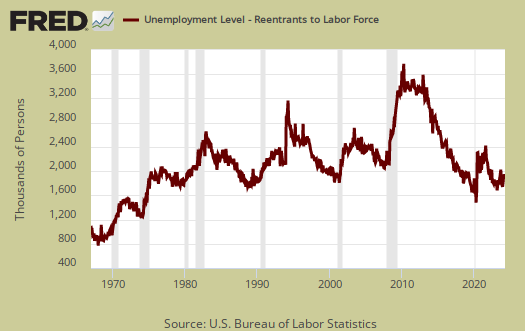
People join the ranks of the unemployed because they were laid-off, fired, they quit, the job was temporary and thus ended, they entered the labor force for the first time and re-entrants. Re-entrants are people with work experience, yet have been considered not in the labor force for some time. Recall to be considered unemployed one has to be actively searching for a job. As a percent of the unemployed, re-entrants are at a lower percentage as this group declined by -129 thousand people this month.
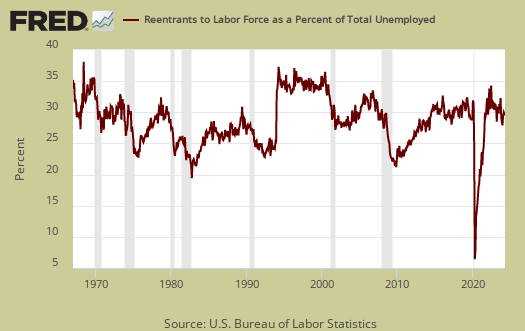
If one looks at the levels of re-entrants, or people considered not in the labor force who started actively looking for a job again, the levels are at all time highs. This is yet another sign on how people are not finding work, giving up, then dropping out of the labor force and then trying again to get a job. If the job market was good, we would not see record levels of re-entrants as shown in the below graph.
Here is our overview of last month's CPS unemployment statistics.
Do people realize how bad this really is?
The labor participation rate and those not in the labor force is not just a one month statistical variance. This has happened multiple times this year, where over half a million more.
Over the weekend, I hope to do some drill down into these figures to get some more insight but bottom line, when I saw the release I knew this is much worse news than the top level figures imply simply because this has happened now multiple times in the last year.
while you're drilling down...
explain this:
comparing the unadjusted data from the two surveys, the establishment survey shows payrolls jobs increased by 378,000 from 135,583,000 in July to 135,961,000 in August; the seasonal adjustment increased the payroll jobs to 136,133 but reduced the change to 169,000; meanwhile, the unadjusted household data shows employment dropped 604,000, from 145,113,000 in July to 144,509,000 in August...the action of the seasonal adjustment on the household survey was the opposite, in that it reduced the negative change to 115,000, from 144,285,000 in July to 144,170,000 in August....thus the seasonal adjustment subtracted from job gains in the establishment survey, but it added to those employed in the household survey..
rjs
I'll leave that to you
The surveys are taken at different months and there is also the "birth/death" model in the establishment survey. Why I show the annual change as well due to the huge variance, it's 100k for payrolls, 400k for the CPS in terms of confidence levels/error margin/accuracy.
the drug war must end
I know at least 50 people including myself that dropped out of the work force many years ago due to the unconstitutional substance testing or drug testing... They can keep their anti-American communist job if I have to be a laboratory rat used for testing. Thousands of Americans will go back to work after the failed congress changes their insane policy.
Thousands more have left the work force and businesses have shut due to the other insane and illegal policies fro the idiots in congress, such as the NDAA and other communist polices. After obama signed that unconstitutional law, I shut down my web development business,, waiting till congress fixes their insane policy so I can go back to work.
Now we have the NSA basically shutting down the internet
Lets have some more policies from the idiots in congress to put more people out of work.
Congress should create a worker and business friendly environment for America to move forward, not more asinine policies that throw people from the work force and shut business down.
Dude, your drug use should end
Sorry but these are police state policies and it has nothing to do with "communism". Your comment reads like you are wasted, so I suggest considering getting off drugs and then you won't have to worry about a pee test. Not that I approve of pee tests, except when workers are driving, operating machinery and so on.
It boggles my mind how convoluted the conservative talk radio spins privacy violations, corporatism, police state as being somehow "socialist" or "communist". Even more frightening is I don't believe anybody cracked a textbook or history book. Try the Nazis for a better analogy, or even psycho Stalin, was a authoritative dictatorship vs. "communism".