The BLS unemployment report shows total nonfarm payroll jobs gained were 148,000 for September 2013, with private payrolls adding 126,000 jobs. Government jobs increased by 22,000. Additionally 20,000 of September's jobs were temporary ones. Overall job growth was barely enough to keep up with the growing population.

July's were revised down to 89,000 and August was revised upward to 193,000. The BLS employment report is actually two separate surveys and we overview the current population survey in this article.
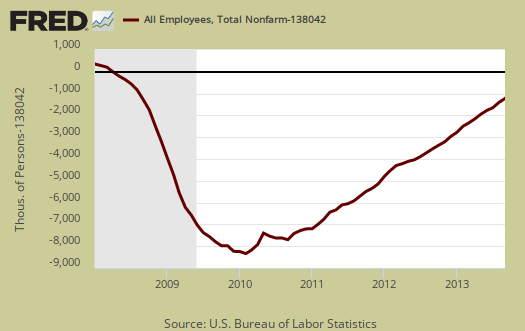
The start of the great recession was declared by the NBER to be December 2007. The United States is now down -1.72 million jobs from December 2007, five years, nine months ago as shown in the below graph.
We broke down the CES by industry to see what kind of percentage changes we have on the share of total number of payroll jobs from 2008 until now. Below is the percentage breakdown of jobs by industry for January 2008.

Below is the breakdown of jobs growth per industry sector for September 2013. From these two pie charts we can see the job market has changed into more crappy, low paying service jobs of health care assistance and restaurant workers. We expected to see construction jobs shrink relative to total payrolls and it did, by 1.1 percentage points. Manufacturing, of which the auto industry is a part, has contracted 1.1 percentage points as share of total jobs. The financial sector, only shrank 0.2 percentage points as it's share of payroll jobs, in spite of being the maelstrom behind the recession. The manufacturing sector just continues to erode and if one thinks about it, the manufacturing job implosion should not be so great due to the causes of the recession. Health care has gained the most jobs, yet working in a nursing home and as attendants are also low paying jobs.

Below is a bar chart showing the employer's payroll growth since January 2008. We see health care jobs, part of education and health sector, is the only real growth sector, along with very low paying restaurant jobs in leisure and hospitality. Remember professional and business includes waste management and low paying administrative types of jobs. Manufacturing has just been decimated.
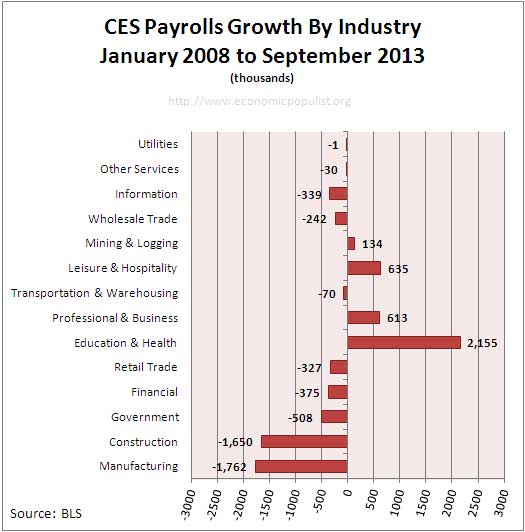
Job gains for the past year, from September 2012 to September 2013 are shown below. While one might think professional and business jobs are good jobs, this isn't quite true. There are many low paying office worker and waste management services jobs in this category. Additionally the BLS counts foreign guest workers in their employment statistics, so in the Science & Technology fields, don't assume those jobs went to Americans.

Just to keep up with population growth, we need at least 100,000 jobs per month or 1.2 million a year and this estimate assumes the current artificially low labor participation rates ant this month the labor participation rate not seen since August 1978.
Private Sector jobs, or jobs not in government gained 128 thousand this month. The United States is still down -1.256 million private sector jobs from the start of the recession. Below is a graph of just the private sector payroll losses since January 2008.

Below is a bar chart of the payroll gains by industry sector for the month. Within Professional and Business jobs, 20,200 of the gains represent are temporary work. Surprising, Leisure and hospitality sector actually lost jobs. This occupational area includes dishwashers, restaurant workers and has the lowest wages as a sector. Professional services also includes foreign guest workers, so we do not know the percentage of unemployed Americans in these figures. Administration and waste management is the growth engine, with 24.3 thousand jobs added this month.
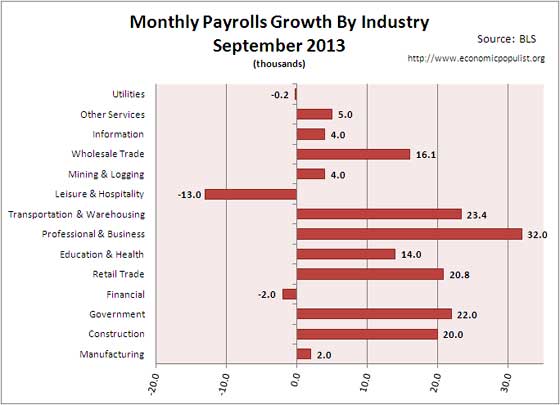
This month manufacturing only added 2,000 jobs. Generally speaking manufacturing just been hammered and the United States needs way more jobs in manufacturing to support a middle class.

Below is a graph of auto & parts manufacturing, which this month lost 200 jobs.

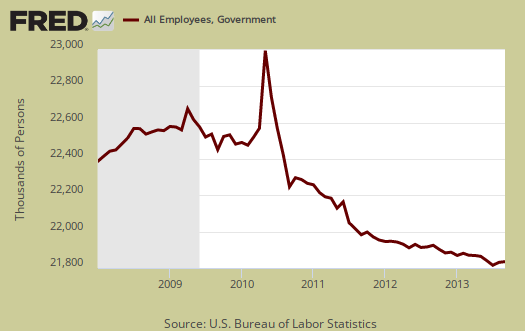
Government overall gained 22,000 jobs for the month with state governments adding 22,000. Federal jobs were down another -6,000. This report is before the shutdown, although the furloughed workers are back to work now.
The construction housing bubble collapse jobs slaughter is clearly over. This month construction added 20,000 jobs. Don't expect to see the housing bubble construction job growth so the lost jobs in this area are probably gone forever.

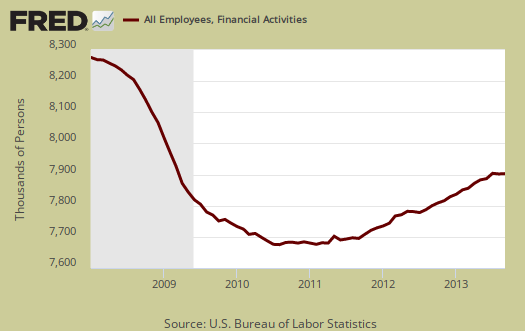
This month the financial sector lost another -2,000 jobs overall with credit intermediation losing -7,700 of them. Credit intermediation is a fancy way of moving debt and assets around through various financial instruments.
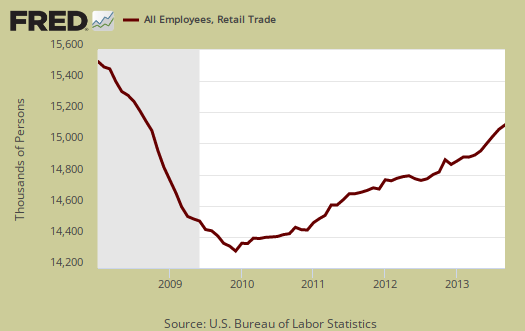
Retail trade are the retail sales outlets like big box marts, direct mailing and anything retailing merchandise. For the month retail trade added 20.8 thousand jobs this month. These were mainly low paying jobs and across categories.
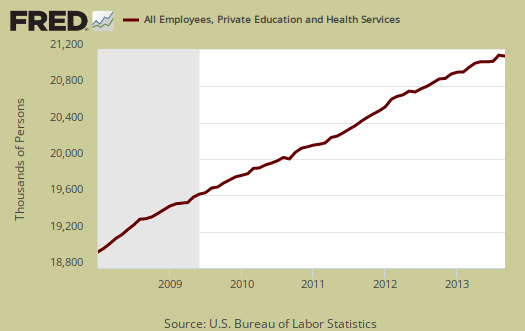
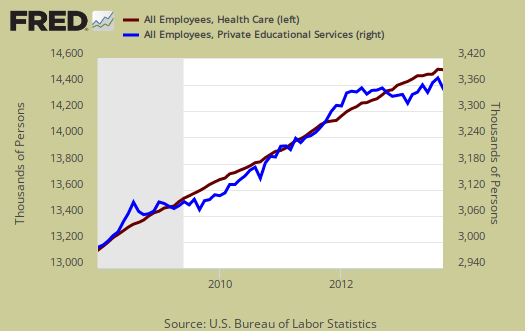
Education and health services has consistently been increasing and this month added 14 thousand jobs total. Of those jobs, 13.7 thousand were in health care.
When one breaks down the Education and Health Services job figures, it becomes clear the growth is mainly in health care jobs. Graphed below is health care jobs, on the left (maroon) against education jobs, on the right (blue).
Professional & Business services contains management, career professionals, science & technical, administrative and support and finally waste services and this month gained 32 thousand jobs.

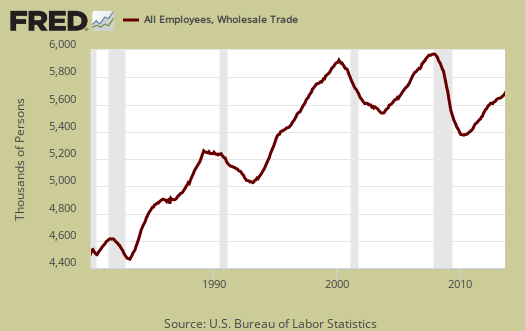
Wholesale trade gained 16,100 jobs from last month. Wholesale trade included fabless semiconductors and other offshore outsourcers. Since they offshore outsourced manufacturing, they now are considered wholesale intermediate distributors. Below is a graph of wholesale trade employment and one can tell, by the flattening, really increasing around year 2000, offshore outsourcing continues unabated.
The information sector gained 4 thousand jobs. This includes newspapers and film production.

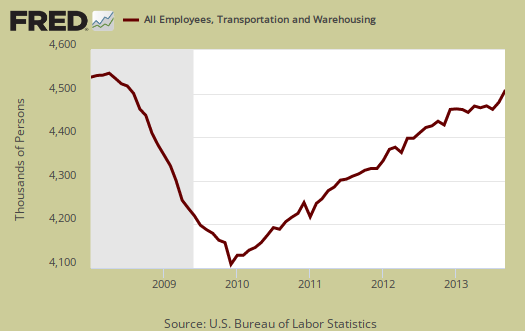
Transportation and warehousing are jobs as one would expect from the sector title, airline workers, truckers, working in warehousing and employment associated with trade, such as port dock workers. This month the sector added 23.4 thousand jobs.
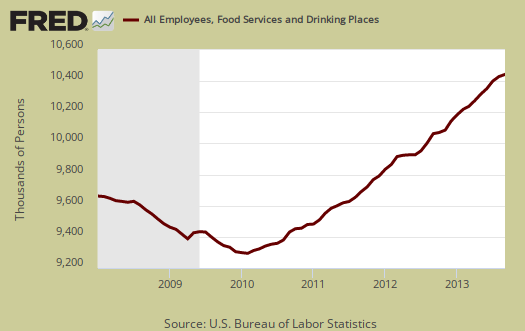
Leisure & Hospitality has the lowest paying jobs of them all. This month the sector actually lost -13,000 jobs with losses across the board. Food service can even pay below minimum wage. This is a first to see job loss in this area as most of the job growth in the past has been in restaurant worker jobs.
Bottom line, this month payroll growth slowed and we expect to see even less payroll growth for the rest of the year due to the ripple effects of the government shutdown.
Here is our overview of the unemployment statistics.

here's my problem..
the unadjusted payroll data showed a gain of 411,000 jobs in August; but the seasonal adjustment lowered that to 193,000 jobs gained, while September's unadjusted establishment survey data showed an increase of 612,000 jobs, which was lowered by the seasonal adjustment to the headline 148,000 job gain...conversely, the household survey showed a 604,000 drop in the count of the employed in August, which was raised to a loss of just 115,000 in the employed, while in this September household survey, unadjusted employment rose 142,000, and the seasonally adjustment lowered that by a trivial 9,000 to an increase of 133,000 employed...so, over the course of the past two months, the seasonal adjustments subtracted 682,000 from the payroll jobs recorded by the establishment survey, while the seasonal adjustments on the household survey added 480,000 to the count of those employed...
so, why is there such a great disparity between the seasonal adjustments in the two surveys? since they do contact different demographics, i wouldn't expect them to move in lockstep, but that much of a divergence just doesn't make sense...
rjs
seasonal adjustments
I think generally it is a big mistake to try to make sense out of the monthly difference between seasonal and not seasonally adjusted on employment. It really varies. Because it varies so much the fact two large adjustments do not coincidence in a month could just mean the date of the surveys and the reference windows.
Take a look in Fred, as an example on just payrolls and you can do the same on employed for the CPS. Pretty clear employment is really cyclical (which is scary considering how people need full time jobs year round, but it also might be "hiring seasons" for full time, year round causing this).
http://research.stlouisfed.org/fredgraph.png?g=nN9
it's the inconsistencies
i understand there was a 882,600 job seasonal increase in employment at local school districts, which was adjusted down to a net payroll jobs gain of just 9,500, and a 468,000 seasonal decrease in jobs in leisure and hospitality, as most temporary summer jobs wound down, which was also almost wiped out by the seasonal adjustment, but what i still cant see is that if one survey says there's an abnormal increase or decrease in jobs in a given month and adjusts it to norm, then why does the other survey do the opposite in the same time frame?
rjs
because the surveys are different
There has been delays and out of syncs like this many times. They are different time windows, one is a week, where work is defined as even 1 hour or 15 hours of UNPAID,, the other is the 12th of the month but defined by "pay period" and most workers in the U.S. are paid bi-weekly.. CPS error margin 400k, CES, 100k. CES way larger than CPS.
Below is a graph of CPS employed against CES/Payrolls employment, both not seasonally adjusted.
There is an express, looking for signal in the noise floor. So, I think you're in the noise floor when looking at NSA on a monthly basis.
i'll have to think about this
i see what has happened there....i'll have to think about what that implies...
one thought that comes to mind is that the surveys should not be released together, because that suggests they're measuring the same population, when they are not..
rjs
This is why there are two articles
People get confused so often between the two I decided to break up the overviews into two separate articles.
I think the BLS should separate the releases. They could release them both on the same day but put out two separate releases to help make it clear they are separate surveys.
I mean, come on, even people in finance, economics have to go study this thing to understand it, yet the reports making blaring headlines around the globe.