
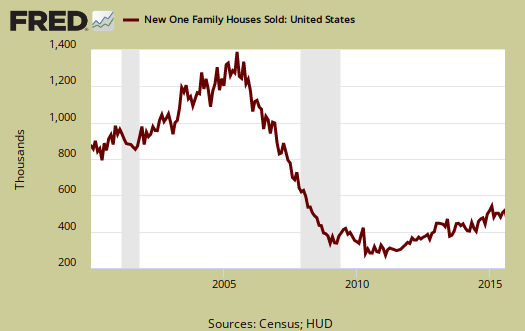
The August 2015 New Residential Single Family Home Sales increased by 5.7%. Sales jumped up by 30,000 annualized units to 552,000 for the month. July was significantly revised upward from 507 thousand to 532 thousand sales. These are levels not seen since February 2008. For the year, new single family home sales are up 21.6% from the year ago 454,000 sales levels. The annual increase is equal to the ±18.7% margin of error. In this Census survey, amounts are annualized and represent what the yearly volume would be if just that month's rate were applied to the entire year. These figures are also seasonally adjusted. The monthly percentage changes are always in between error margins (this month ±16.2%) and sales figures are almost always revised.
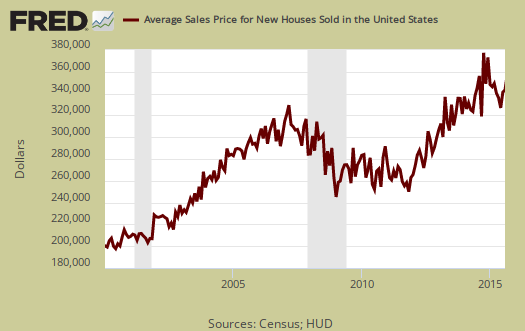
The August 2015 average home sale price was $353,400. This is a 2.5% monthly increase. From a year ago the average price has changed by 0.5%. Overall it appears prices are really flat lining from a year ago and this should be no surprise since they are clearly not affordable for most people.
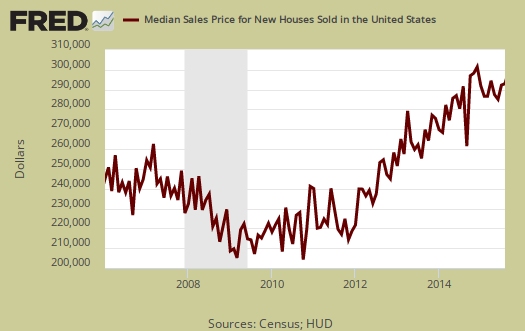
The median home price is $292,700 and had a 0.5% change from the previous month. From August 2014, the median new home sales price also has almost no change, 0.3%. Median means half of new homes were sold below this price and both the average and median sales price for single family homes are not seasonally adjusted.
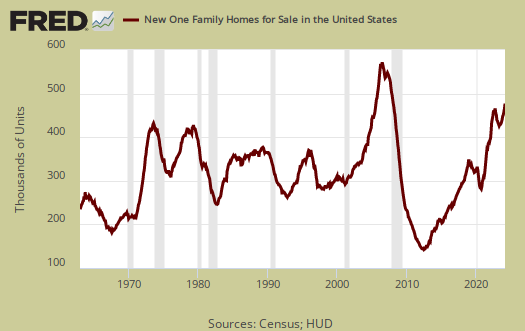
Inventories: New homes available for sale is now 216,000 units, a 0.5% increase from last month. From a year ago inventories have increased 5.4% and this is outside the ±6.1% margin of error. The monthly change is also outside the ±2.0% error margin.
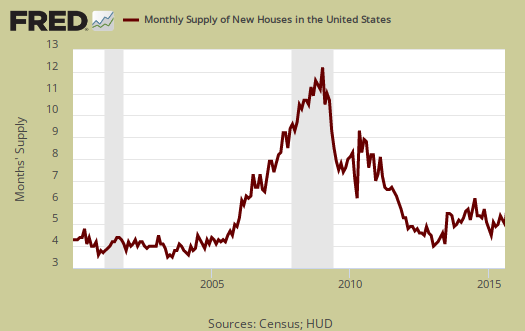
The graph below shows how long it would take to sell the new homes on the market at each month's sales rate. For June the time stands at a very low 4.7 months. This is a -4.1% monthly change with a whopping -13% annual drop. That is a very tight new homes sales market.
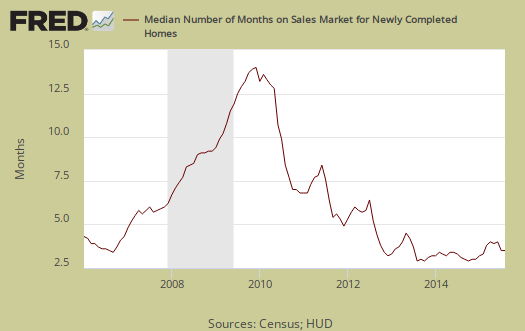
The median time a house was completed and on the market to the time it sold was 3.7 months. From a year ago that time period was 3.1 months. This implies the median time to move new properties is still reasonably stable.
Even after the housing bubble popped new home sales were in the 600 thousand range, so sales are really returning to decade old levels while the potential home buyer population has increased. The median price is way above 2006 levels.
A note on Census New Home Sales survey report: The variance in monthly housing sales statistics is so large, in part, due to the actual low volume overall, along with the fact this is a survey. One needs to look at least a quarter of time to get a real feel for new home sales, but a year of sales data is more in order. Additionally this report, due to it's huge margin of error, is almost always revised significantly the next month. Buyer beware on month to month comparisons and reacting to primarily figures and why we graph up the statistics so one can identify a real trend versus press headline buzz. The graphs show the trend much better than the monthly percentage changes.
The Census notes that the average revision is about 5% of the original reported. Here are our overviews of residential real estate statistics, only some graphs revised.
graphs
Frankly I couldn't get the Fed to update but they should be tomorrow.
FRED
some their graphs dont load with the current dataset showing; you have to jog the interactive bar on the bottom to the right to get it to appear...i've complained about that and a bunch of other issues several times without much being fixed, even after correspondence with the woman who supervises that operation...i wanted to embed some interactive FRED graphs, but if i did, i'd have to write an explanation on how to get the data to show up..what good is a graph if it doesn't show the current data when it's first loaded?
rjs
I don't use FRED that way, long story
I used a different calling method and please do not use their "embedded" code for it slows down the site and doesn't scale right.
they fixed the old (restored it) enough so I could still use it and thank god because that's thousands of graphs.