
The Mortgage Monitor for September (pdf) from Black Knight Financial Services (BKFS, formerly LPS) reported that there were 737,254 home mortgages, or 1.46% of all mortgages outstanding, remaining in the foreclosure process at the end of September, which was down from 747,930, or 1.48% of all active loans that were in foreclosure at the end of August, and down from 1.89% of all mortgages that were in foreclosure in September of last year. These are homeowners who had a foreclosure notice served but whose homes had not yet been seized, and the September "foreclosure inventory" remains the lowest percentage of homes that were in the foreclosure process since late 2007. New foreclosure starts, however, rose for the second month in a row, from 76,180 in August to 79,899 in September, up more than 10% from July, while they remain lower than the 95.400 new foreclosures started in September of 2014, they've been volatile from month to month, and they have remained in a range about 50% higher than number of new foreclosures we saw in the precrisis year of 2005.
In addition to homes in foreclosure, BKFS data showed that 2,456,739 mortgages, or 4.87% of all mortgage loans, or were at least one mortgage payment overdue but not in foreclosure in September, up from 4.79% of homeowners with a mortgage who were more than 30 days behind in August. That’s the highest mortgage delinquency rate since May, while it’s still 11.4% lower than the mortgage delinquency rate of 5.66% in September a year earlier. Of those who were delinquent in September, 816,725 home owners, or 1.62% of those with a mortgage, were considered seriously delinquent, meaning they were more than 90 days behind on mortgage payments, but still not in foreclosure at the end of the month. Combining these totals, we find a total of 6.33% of homeowners with a mortgage were either late in paying or in foreclosure at the end of September, and 3.08% of them were in serious trouble, ie, either "seriously delinquent" or already in foreclosure at month end...
The Mortgage Monitor (pdf) is a mostly graphics presentation from what was once the Analytics division of Lender Processing Services that covers a variety of mortgage related issues each month. The graph below, from page 6 of the mortgage monitor, shows the percentage of mortgages that were 30 days, 60 days or more than 90 days delinquent for each quarter since the beginning of 2005. Seriously delinquent mortgages, or those more than 90 days behind on payments but not yet in foreclosure, are shown in black; those mortgages more than 60 days but less than 90 days late are shown in red, while those mortgages that are just one month behind in payments are shown in blue. You can see that the seriously delinquent mortgages in black continue to fall steadily and as of the 3rd quarter amount to 1.62% of mortgage loans outstanding, down 4.3% from the 2nd quarter down 25.2% from a year ago, and down from nearly 5 1/2% of all mortgages in late 2009. 60 day delinquency rates in red, however, have been up each of the past two quarters, but at 0.85% of all mortgages outstanding are still down 11.0% from a year ago. Meanwhile, 30 days delinquencies in blue were up 4.7% in the quarter, but are down 5.5% from a year ago, and as BKFS tells us, still below the 2005 level of 30 day late loans...

The next graph, from page 8 of the Mortgage Monitor, shows the percentage of mortgage loans that have become more than 60 days late in the prior 6 months, separated into three groups based on when these newly mortgages originated. The green graph shows the percentage of those loans originating before 2005 that became "severely delinquent", from a prior up to date status for each month going back to January 2005. The red graph shows the percentage of loans originating between 2005 and 2008 that transitioned to "severely delinquent", or 60 days behind, over the same time period, while the blue graph shows the percentage of loans originating after 2009 that fell 60 days behind on their payments from a prior paid up status. What we see here is that although those new post crisis mortgages make up 68% of all mortgages outstanding, they only account for a small percentage of the mortgage loans transitioning into trouble. On the other hand, while bubble era vintage mortgages only account for 17% of current active mortgages, they still account for 45% of all new severely delinquent loans.

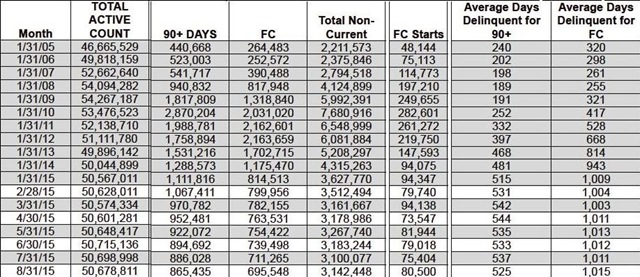
In a statistical summary from page 14 of the pdf, the columns in the table below show the total active mortgage loan count nationally for each month given, number of mortgages that were delinquent by more than 90 days but not yet in foreclosure, the monthly count of those mortgages that are in the foreclosure process (FC), the total non-current mortgages, including those that just missed one or two payments, and then the number of foreclosure starts for each month the past year and for each January shown going back to January 2005. In the last two columns, we see the average length of time that those who have been more than 90 days delinquent have remained in their homes without foreclosure, and then the average number of days those in foreclosure have been stuck in that process because of the lengthy foreclosure pipelines. This table has been revised from last month's data and now shows the average length of delinquency for those who have been more than 90 days delinquent without foreclosure is now at 510 days, down from 519 in August and down from the April record of 536 days, as some of those who have been delinquent the longest are now transitioning to foreclosure. Meanwhile, the average time for those who’ve been in foreclosure without a resolution is also off its record high of 1061 days first reached in last October, but is still nearly three years at 1056 days…

(NB: the above was crossposted from Marketwatch 666)
that's astounding
Over three years to foreclose, that's quite a bit of free rent going on.
Another housing bubble?
Daily Kos: The massive real estate bubble that no one is talking about (Monday Nov 09, 2015)
http://www.dailykos.com/stories/2015/11/9/1447788/-The-massive-real-esta...
* This is not my field of expertise, so maybe someone can verify.
echo bubble maybe
clearly, housing prices can't continue to increase at a 6% rate while incomes are rising at a 2% rate indefinitely, so an adjustment will be in order (who knows when)...if long term interest rates rise, so will the monthly cost of buyiing a home, which will also put downward pressure on housing list prices...
rjs