
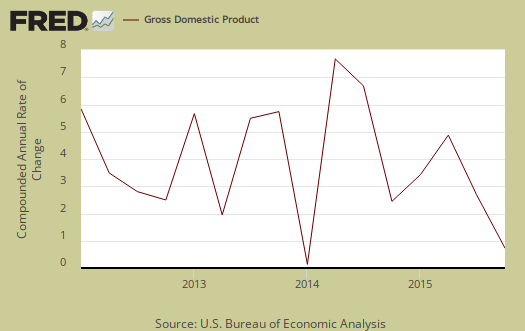
Q4 GDP was revised upward from 0.7% to 1.0%. The primary causes of the upward revision were inventories contracted much less than originally estimated and imports were much less. Government spending was revised downward and consumer spending was also, although slightly With this revision Q4 GDP still shows fairly weak economic growth.

As a reminder, GDP is made up of: where Y=GDP, C=Consumption, I=Investment, G=Government Spending, (X-M)=Net Exports, X=Exports, M=Imports*. GDP in this overview, unless explicitly stated otherwise, refers to real GDP. Real GDP is in chained 2009 dollars.
The below table shows the Q4 GDP component revision comparison in percentage point spread. As we can see import damage was less and the real change was in investment. Changes in private inventories is part of investment.
| Comparison of the Q4 2015 GDP Revised Components | |||
|---|---|---|---|
|
Component |
Q4 Revised |
Q4 Advance |
Spread |
| GDP | +1.00 | +0.70 | +0.30 |
| C | +1.38 | +1.46 | -0.08 |
| I | -0.12 | -0.41 | +0.29 |
| G | -0.01 | +0.12 | -0.13 |
| X | -0.34 | -0.31 | -0.03 |
| M | +0.09 | –0.16 | +0.25 |
The below table shows the comparison between Q3 GDP components and the newly revised Q4 ones.
| Comparison of Q3 2015 and Q4 2015 GDP Components | |||
|---|---|---|---|
|
Component |
Q3 2015 |
Q4 2015 |
Spread |
| GDP | +1.99 | +1.00 | -0.99 |
| C | +2.04 | +1.38 | -0.66 |
| I | -0.11 | -0.12 | -0.01 |
| G | +0.32 | -0.01 | -0.33 |
| X | +0.09 | -0.34 | -0.43 |
| M | -0.35 | +0.09 | +0.44 |
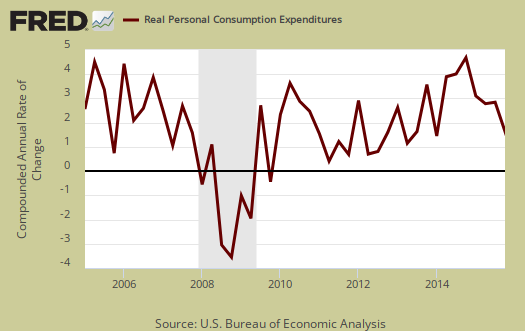
Consumer spending, C remains the dully lit bright spot in overall GDP. A 1.38 percentage point increase is not very strong growth as evidenced by the fact it is a 2.0% change from Q3. Below is a percentage change graph in real consumer spending going back to 2005.
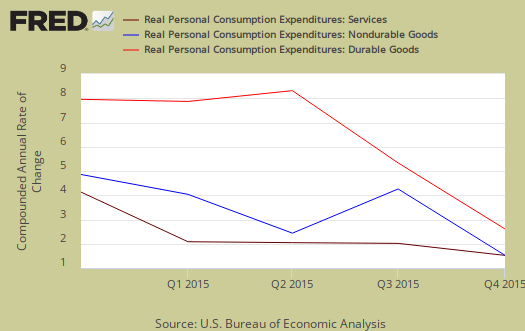
Goods was revised downward from 0.53 percentage points to GDP to 0.42 percentage points. Within goods, durables contributed 0.25 percentage points. Services was a 0.96 percentage point contribution. Within services, health care remained high was a 0.41 percentage point contribution to Q4 GDP. Graphed below is PCE with the quarterly annualized percentage change breakdown of durable goods (red or bright red), nondurable goods (blue) versus services (maroon).
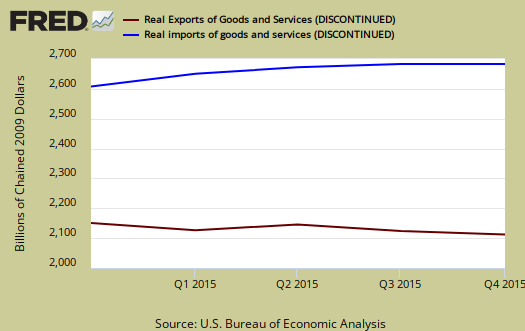
Imports and Exports, M & X was revised significantly, from a –0.47 percent point contribution to -0.25 percentage points. Imports are commonly revised as the last month of trade data comes in.
Government spending, G contributed -0.01 percentage points to Q4 GDP with state and local spending just revised lower, now a -0.16 percentage points contribution.

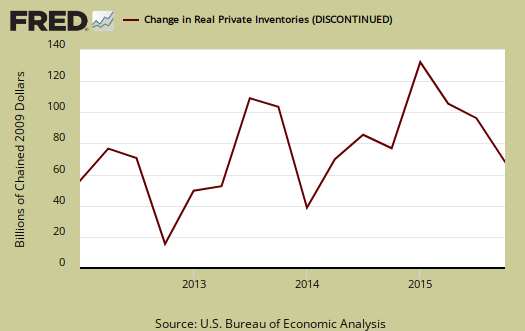
Investment, I is made up of fixed investment and changes to private inventories. The change in private inventories alone was revised from a -0.45 percentage point contribution to -0.14. Below are the change in real private inventories and the next graph is the change in that value from the previous quarter.

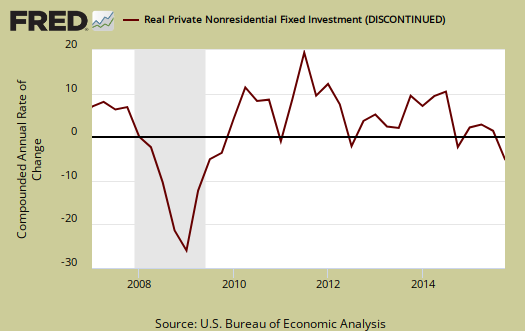
Fixed investment is residential and nonresidential and was just 0.02 percentage points of GDP contribution. Nonresidential was a -0.24 individual percentage point contribution.
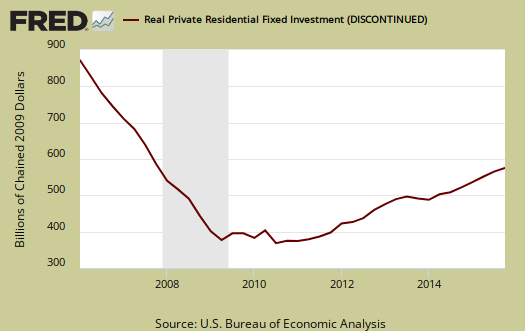
Residential fixed investment was 0.26 percentage points to GDP. The below graph shows residential fixed investment.
Nominal GDP: In current dollars, not adjusted for prices, of the U.S. output,was $18,148.4 billion, a 2.0% annualized increase for Q3 from Q4. In Q3, current dollar GDP increased 3.3%.
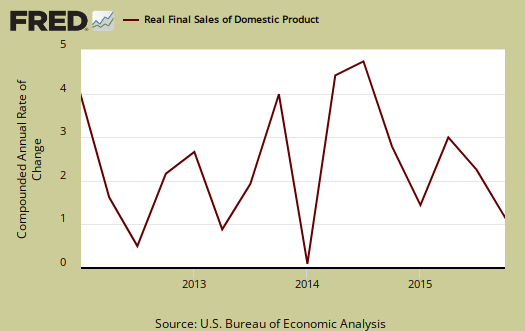
Real final sales of domestic product is GDP - inventories change. This figures gives a feel for real demand in the economy. This is because while private inventories represent economic activity, the stuff is sitting on the shelf, it's not demanded or sold. Real final sales increased 1.2% and did not change in the revision.
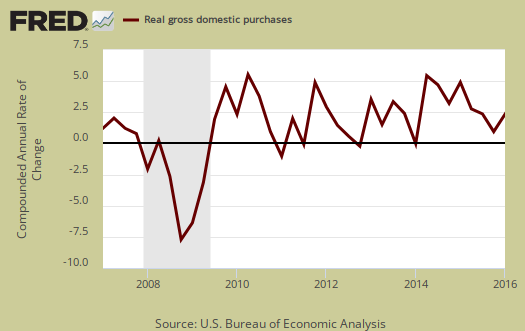
Gross domestic purchases are what U.S. consumers bought no matter whether it was made in Ohio or China. It's defined as GDP plus imports and minus exports or using our above equation: where P = Real gross domestic purchases. Real gross domestic purchases increased 1.2% in Q4. Exports are subtracted off because they are not available for purchase by Americans, but imports are available for purchase in the U.S. When gross domestic purchases exceed GDP, that's actually bad news, it means America is buying imports instead of goods made domestically.
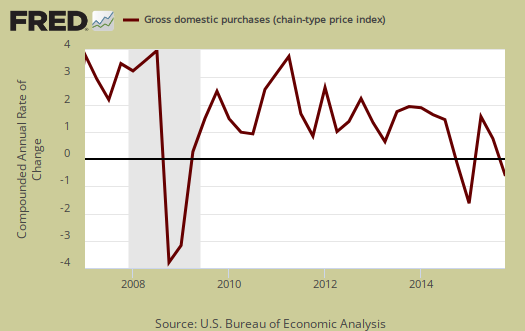
The price index for gross domestic purchases increased 0.4% for Q4. This is double the original estimate. Without food and energy considered, the core price index increased 1.0%. In Q3 the price index was 1.3% for both the overall and without food and energy considered. That's far below the Federal Reserve's target inflation rate, especially when taking gasoline prices out of the equation. Below is the price index for gross domestic purchases.
Below are the percentage changes of the Q4 2015 GDP components, from Q3. The thing to notice is how exports improved for Q2. There is a difference between percentage change and percentage point change. Point change adds up to the total GDP percentage change and is reported above. The below is the individual quarterly percentage change, against themselves, of each component which makes up overall GDP. The advance report showed investment changed -2.5%. Additionally these changes are seasonally adjusted and reported by the BEA in annualized format.
|
Q4 2015 GDP Component Percentage Change (annualized) |
|||
|---|---|---|---|
| Component | Percentage Change from Q3 | ||
| GDP | +1.0% | ||
| C | +2.0% | ||
| I | -0.7% | ||
| G | -0.1% | ||
| X | -2.7% | ||
| M | -0.6% | ||
This GDP report implies a continuing slowing economy although future indicators of slowing are less by the changes in private inventories. Inventories has accelerated contracting still for two quarters, but now much more at a similar pace. More telling is how consumer spending growth is muddled. One can thank imports for saving GDP but as the global economy heats back up, don't expect that to last.
Other overviews on gross domestic product can be found here. The BEA GDP site is here.
an upward revision of 0.19 percentage points to 4th quarter GDP
.today's construction spending report showed the December spending estimate was revised 0.6% higher, from $1,116.6 billion to $1,123.5 billion, while November's construction spending was revised from $1,116.0 billion to $1,116.9 billion, which together would suggest an upward revision to 4th quarter GDP of 0.19 percentage points..
rjs