
The February 2016 ISM Manufacturing Survey is yet another month of manufacturing malaise. Manufacturing is in a 5th month of contraction, although much less so than last month. PMI was 49.5%, 1.3 percentage points higher than January. New orders had no change in acceleration but employment and production did improve. A contracting manufacturing sector five months in a row is now due to supplier deliveries, contracting inventories and employment. A five month contraction in manufacturing is surely a very sick coal mine canary, regardless.

The ISM Manufacturing survey is a direct survey of manufacturers. Generally speaking, indexes above 50% indicate growth and below indicate contraction. Every month ISM publishes survey responders' comments, which are part of their survey. This month the comments were amazingly upbeat considering the actual index. Petroleum and Coal mentioned low prices impacting their business. Food and beverages said business was sluggish while Chemical productions mentioned a weak overseas demand.
New orders had no change from last month and stayed at 51.5%, which is slight growth.

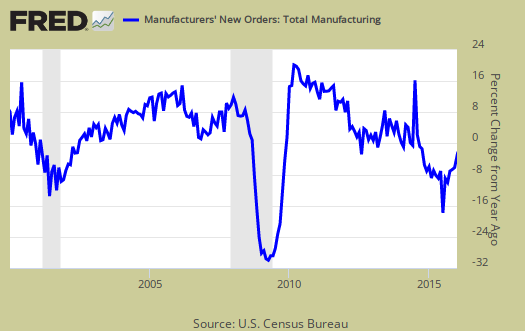
The Census reported January durable goods new orders shot up by 4.9%, where factory orders, or all of manufacturing data, will be out later this week. Note the Census one month behind the ISM survey. The ISM claims the Census and their survey are consistent with each other and they are right. Below is a graph of manufacturing new orders percent change from one year ago (blue, scale on right), against ISM's manufacturing new orders index (maroon, scale on left) to the last release data available for the Census manufacturing statistics. Here we do see a consistent pattern between the two and this is what the ISM says is the growth mark:
A New Orders Index above 52.3 percent, over time, is generally consistent with an increase in the Census Bureau's series on manufacturing orders.
Below is the ISM table data, reprinted, for a quick view.
| ISM Manufacturing February 2016 | ||||||
|---|---|---|---|---|---|---|
| Index | January 2016 | February 2016 | % Change | Direction | Rate of Change | Trend Months |
| PMI™ | 48.2 | 49.5 | +1.3 | Contracting | Slower | 5 |
| New Orders | 51.5 | 51.5 | 0.0 | Growing | Same | 2 |
| Production | 50.2 | 52.8 | +2.6 | Growing | Faster | 2 |
| Employment | 45.9 | 48.5 | +2.6 | Contracting | Slower | 3 |
| Supplier Deliveries | 50.0 | 49.7 | -0.3 | Contracting | From Unchanged | 1 |
| Inventories | 43.5 | 45.0 | +1.5 | Contracting | Slower | 8 |
| Customers' Inventories | 51.5 | 47.0 | -4.5 | Too Low | From Too High | 1 |
| Prices | 33.5 | 38.5 | +5.0 | Decreasing | Slower | 16 |
| Backlog of Orders | 43.0 | 48.5 | +5.5 | Contracting | Slower | 9 |
| Exports | 47.0 | 46.5 | -0.5 | Contracting | Faster | 2 |
| Imports | 51.0 | 49.0 | -2.0 | Contracting | From Growing | 1 |
| OVERALL ECONOMY | Growing | Faster | 81 | |||
| Manufacturing Sector | Contracting | Slower | 5 | |||
Production is the current, we're makin' stuff now meter and did pop up by 2.6 percentage points from last month. Production usually follows incoming orders in the next month.

ISM's manufacturing production index loosely correlates to the Federal Reserve's industrial production, but not at 50% as the inflection point, instead 51.1% to indicate growth. Below is a quarterly graph of the ISM manufacturing production index (left, maroon), centered around the inflection point, quarterly average, against the Fed's manufacturing industrial production index's quarterly change (scale right, blue). We can see there is a matching pattern to the two different reports on manufacturing production.

The manufacturing ISM employment index also popped up by 2.6 percentage points to 48.5%, but this is still contraction. The neutral point for hiring vs. firing is 50.6%. Below are the BLS manufacturing non-farm payrolls (jobs) for the past decade on the left (maroon), graphed against the ISM manufacturing employment index on the right (blue). The BLS manufacturing payrolls is the monthly percentage change and the ISM manufacturing employment index is centered around it's inflection point of contraction and employment growth.

The inventories index has been contracting for the 8th month in a row, although finally a little more slowly. Changes in inventories contributes to GDP. Inventories gives an estimate of how much raw materials manufacturers have on hand and the contraction implies manufacturers expect a slow down to continue. Quoted below is the relationship between BEA and ISM inventories, not the 50% inflection point one would assume.
An Inventories Index greater than 42.9 percent, over time, is generally consistent with expansion in the Bureau of Economic Analysis' (BEA) figures on overall manufacturing inventories in chained 2000 dollars.

Supplier deliveries are how fast manufacturers can get their supplies. A value higher than 50 indicates slower delivery times, a value below 50 means the supply chain is speeding up. The index decreased by -0.3 percentage points to 47.0% which is faster. You may wonder why slow deliveries would boost up PMI and indicate stronger growth in manufacturing. The reason is slower vendor performance means there is probably higher demand for that supply and thus indicates increasing activity.

Order backlogs really showed some promise with a 5.5 percentage points to 48.5%. While this is still in contraction it is must less so. Order backlogs have been in contraction for the last nine months and that really isn't a good thing. Less order backlogs would imply there is no need to ramp up production to catch up.

Imports declined by -2.0 percentage points to 49.0% and went into contraction. Imports are materials from other countries manufacturers use to make their products and high levels isn't too great for economies of scale in the U.S. We want to see U.S. manufacturers use other U.S. manufactured materials instead of imports as much as possible, yet because manufacturers offshore outsourced so much it is hard to discern which is a decline in global demand and which is more lost jobs and production for U.S. suppliers.

New orders destined for export, or for customers outside of the United States declined by -0.5 percentage points to 46.5% and thus contracted faster. Manufacturing exports can also imply pick up and slow down in global demand.

Prices increased 5.0 percentage points to 38.5%. Declining prices has been going on for 16 months now. The ISM gives an index correlation to BEA price increases of 52.1%.

Customer's inventories declined by -4.5 percentage points to 47.0% and are now too low. Customer inventories, not to be confused with manufacturer's inventories, are how much customers have on hand, and rates the level of inventories the organization's customers have. This is not a good sign, as if customers are expecting a slow down as well.

Here is the ISM industrial sector ordered list of growth and contraction. Note how many sectors are now shrinking.
Of the 18 manufacturing industries, nine are reporting growth in February in the following order: Textile Mills; Wood Products; Furniture & Related Products; Miscellaneous Manufacturing; Electrical Equipment, Appliances & Components; Food, Beverage & Tobacco Products; Chemical Products; Primary Metals; and Paper Products. The seven industries reporting contraction in February — listed in order — are: Apparel, Leather & Allied Products; Petroleum & Coal Products; Computer & Electronic Products; Printing & Related Support Activities; Transportation Equipment; Plastics & Rubber Products; and Fabricated Metal Products.
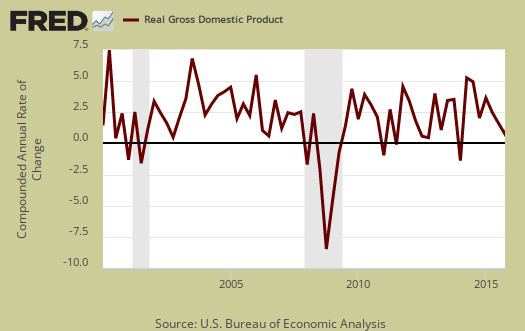
The ISM has a correlation formula to annualized real GDP. February alone gives a 2.0% annual real GDP correlation. The below graph plots real GDP, left scale, against PMI, right scale, real GDP up to Q4 2015. One needs to look at the pattern of the two lines to get anything out of this by quarters graph. If they match, GDP goes up, PMI goes up, would imply some correlation. Yet the estimate against itself is telling that a slowdown did occur at the end of the year.
The ISM manufacturing index is important due to the economic multiplier effect. This just cannot be a good thing to see the ISM manufacturing index showing contraction for so long. . U.S. manufacturing is about an eighth of the economy.
PMI is a composite of equally weighted and seasonally adjusted New Orders, Production, Employment, Supplier Deliveries and Inventories.
The ISM neutral point is 50, generally. Above is growth, below is contraction, There is some some variance in the individual indexes and their actual inflection points as noted above. Here are past manufacturing ISM overviews, unrevised. The ISM has much more data, tables, graphs and analysis on their website. PMI™ stands for purchasing manager's index. On ISM correlations to other indexes, when in dollars they normalized to 2000 values. The above graphs do not do that, so our graphs are much more rough than what the ISM reports these indices track.
Note: The ISM is seasonally adjusting some of these indexes and not others due to the criteria for seasonal adjustment. Those indexes not seasonally adjusted are: Inventories, Customers' Inventories, Prices, Backlog of Orders, New Export Orders and Imports.
Republicans and Lead Pipes
I just watched the GOP debate, and nobody offered anything new. It was the same-ole same-ole.
The GOP's solution for Detroit and Flint Michigan is the same as it is for the entire country — the way to fix the infrastructure and schools and bring back jobs is to lower the tax base. They want us to believe that less tax revenues will fix everything.
The fact is, offshoring jobs to low-wage countries and the increase in corporate tax avoidance has decreased tax revenues, leaving government less money to fix infrastructure, fix schools and replace lead pipes.
The "effective" corporate tax rate (what they actually pay) is lower now than it has been for decades — nominally and as a percent of profits and GDP. Wages have also been stagnant for decades, and in many cases, have declined — while the cost of living has increased.
The GOP wants us to believe that by lowering the tax base, it will bring jobs back from China, induce employers to pay higher wages, and provide enough tax revenues to fix infrastructure, fix schools and replace lead pipes.
The GOP want us to believe that if corporations could pay no taxes at all, all their savings would NOT go into the pockets of executives and shareholders, but into the pockets of working people — and into the city, state, county and federal coffers to fix infrastructure, fix schools and replace lead pipes.
Programs such as Social Security are under-funded, because wages have not kept up with productivity, CEO pay and after-tax profits. But rather than paying higher wages or lifting the "cap" for Social Security taxes, the GOP wants to cut Social Security benefits and raise the age for retirement, claiming we're living longer now (when it's mainly the very rich who are living longer).
Donald Trump says he regularly travels all over the world, and he sees other airports, trains and roads in other countries, and says he's ashamed of our crumbling infrastructure — comparing America to a third world country.
But the GOP wants us to believe that the less we tax the very rich, the more lead pipes we can fix.
Vote for Bernie Sanders to bring jobs back to America and to fix our infrastructure.
needs an article
Trump is clearly going to give unlimited foreign guest worker Visas, as will all of them probably but still that's quite a betrayal from his earlier position.
Bernie does have a proven track record helping U.S. workers with regard to foreign guest worker Visas.