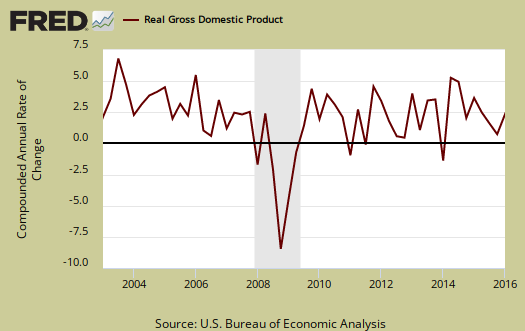
The initial Q1 GDP estimate shows economic growth as a stagnant 0.5%. Consumer spending was all services consumption. Private investment just walloped the economy as both nonresidential fixed investment and the changes in private inventories contracted. Exports also receded. An ominous bright spot is residential investment grew by almost half a percentage point. Government spending added to GDP.
As a reminder, GDP is made up of: where Y=GDP, C=Consumption, I=Investment, G=Government Spending, (X-M)=Net Exports, X=Exports, M=Imports*. GDP in this overview, unless explicitly stated otherwise, refers to real GDP. Real GDP is in chained 2009 dollars.
The below table shows the GDP component comparison in percentage point spread from Q4 to 2016 Q1. If one recalled Q4 initially came in at 0.7%, yet don't expect a repeat revision performance. There are always two revisions after the initial quarterly GDP report release. There will also be annual revisions in July going back three years.
| Comparison of Q1 2016 and Q4 2015 GDP Components | |||
|---|---|---|---|
|
Component |
Q1 2016 |
Q4 2015 |
Spread |
| GDP | +0.54 | +1.38 | -0.84 |
| C | +1.27 | +1.66 | -0.39 |
| I | -0.60 | -0.16 | -0.44 |
| G | +0.2002 | +0.02 | +0.18 |
| X | -0.31 | -0.25 | -0.06 |
| M | -0.02 | +0.11 | -0.13 |
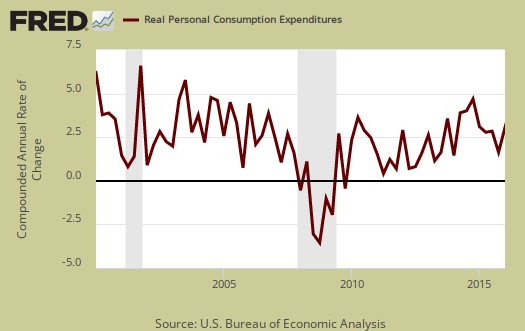
Consumer spending, C was the bright spot, yet that's not saying much. With a 1.27 percentage point increase, that is the third quarter in a row where there is less growth in personal consumption then the previous quarter. Below is a percentage change graph in real consumer spending going back to 2000.
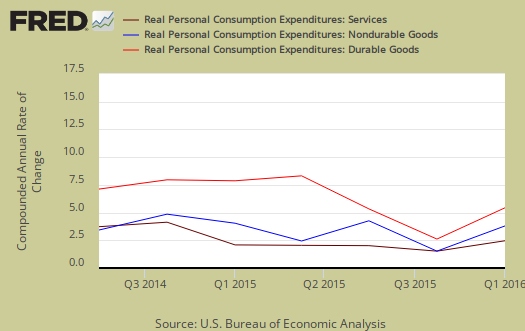
Goods spending didn't contribute much to GDP, 0.03 percentage points. Durables was -0.12 percentage points. Services was a 1.24 percentage point contribution. Within services, health care was a 0.26 percentage point contribution to Q1 GDP, housing and utilities was 0.26 percentage points and our favorite, gross output of nonprofit institutions contributed 0.25 percentage points to GDP growth. Graphed below is PCE with the quarterly annualized percentage change breakdown of durable goods (red or bright red), nondurable goods (blue) versus services (maroon).
Imports and Exports, M & X show the continuing slowdown with a –0.34 percent point contribution. This is the advance GDP estimate, hence actual trade data hasn't come in yet and imports are almost always revised upward, even with petroleum imports declining as a trend. That said, seeing a -0.31 percentage points in U.S. exports does not bode well and implies weak demand for U.S. goods and services.

Government spending, G contributed 0.20 percentage points to Q1 GDP with the defense spending subtracting -0.15 percentage points from GDP while state and local governments added 0.31 percentage points.

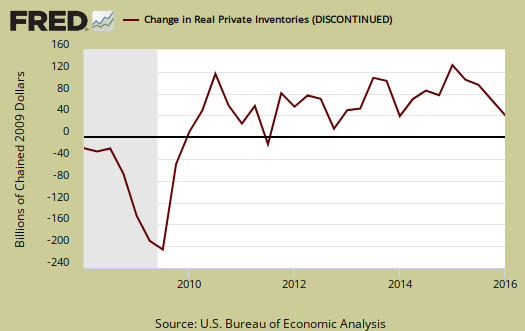
Investment, I is made up of fixed investment and changes to private inventories. The change in private inventories alone was a -0.33 percentage point contribution. Now changes in private inventories have subtracted from economic growth for three quarters in a row. It would be four quarters except Q2 showed no change instead of deceleration. This is a very bad sign for the economy as businesses reduce their stockpiles in response to slowing demand. Below are the change in real private inventories and the next graph is the change in that value from the previous quarter.

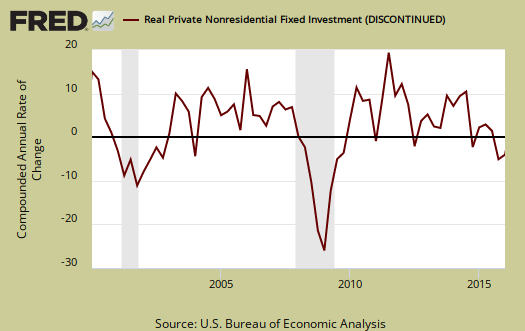
Fixed investment is residential and nonresidential and was also awful with a -0.27 percentage point GDP contribution. Nonresidential was a whopping -0.76 individual percentage point contribution. Within nonresidential, structures subtracted -0.30 percentage points from GDP and equipment was shorn by -0.53 GDP percentage points. Equipment subtracting over half a percentage point of GDP is just an implosion of bad news.
Residential fixed investment on the other hand covered up the bad news in the production economy as it added 0.49 percentage points to GDP. If only subprime would return we'd be all set. The below graph shows residential fixed investment.

Nominal GDP: In current dollars, not adjusted for prices, of the U.S. output,was $18,221.1 billion, a 1.2% annualized increase for Q1 from Q4. In Q4, current dollar GDP increased 2.3%, showing Q1's growth was stunted regardless of inflation figures.

Real final sales of domestic product is GDP - inventories change. This figures gives a feel for real demand in the economy. This is because while private inventories represent economic activity, the stuff is sitting on the shelf, it's not demanded or sold. Real final sales increased 0.9%, which is pretty weak.

Gross domestic purchases are what U.S. consumers bought no matter whether it was made in Ohio or China. It's defined as GDP plus imports and minus exports or using our above equation: where P = Real gross domestic purchases. Real gross domestic purchases increased 0.9% in Q1. Exports are subtracted off because they are not available for purchase by Americans, but imports are available for purchase in the U.S. When gross domestic purchases exceed GDP, that's actually bad news, it means America is buying imports instead of goods made domestically.

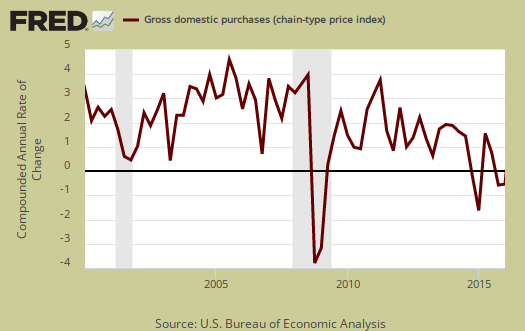
The price index for gross domestic purchases increased 0.3% for Q1. Without food and energy considered, the core price index increased 1.4%. In Q4 the price index was 0.4% for both the overall and without food and energy considered, 1.0%. That's quite below the Federal Reserve's target inflation rate, even when taking gasoline prices out of the equation and rising rents across the country. Below is the price index for gross domestic purchases.
Below are the percentage changes of the Q1 2016 GDP components, from Q4. There is a difference between percentage change and percentage point change. Point change adds up to the total GDP percentage change and is reported above. The below is the individual quarterly percentage change, against themselves, of each component which makes up overall GDP. Additionally these changes are seasonally adjusted and reported by the BEA in annualized format. Durable goods by themselves showed a -1.6% decline. Within investment structures showed a -10.7% drop and equipment wasn't much better with a -8.6% decline. Residential investment on the other hand showed a 14.8% quarterly increase.
|
Q1 2016 GDP Component Percentage Change (annualized) |
|||
|---|---|---|---|
| Component | Percentage Change from 2015 Q4 | ||
| GDP | +0.7% | ||
| C | +1.9% | ||
| I | -3.5% | ||
| G | +1.2% | ||
| X | -2.6% | ||
| M | +0.2% | ||
This GDP report is awful and scary. The things declining like structures and investment imply businesses are not building and growing here. Imploding imports isn't much better or is the negative durable goods spending. Contracting inventories for three quarters in a row is particularly scary. While it could be worse of course, the economy could be contracting, I found myself laying the most hope in the report to all of the three year benchmark revisions coming out June 29th. One thing is certain, report after report being this bad cannot bode well for the employment situation. Perhaps the BLS will also revise their figures and paint black their never ending rosy jobs picture.
Other overviews on gross domestic product can be found here. The BEA GDP site is here.

contrary to media reports, 1st quarter GDP will be revised down
there was widespread media misreporting of the revisions included in the March report on construction spending (pdf); for example, Bloomberg's Econoday said "February is now revised sharply higher; Reuters called it "an upwardly revised 1.0 percent jump in February", and the NY Times reported that the "February increase represented an upward revision by the government from its initial estimate that spending had fallen 0.5 percent"...they are are all wrong...February construction spending was originally reported at $1,144.0 billion annually, and it has now been revised down to $1,133.6 billion annually, and hence spending in March was below what was originally reported for February...what happened was there was a large downward revision to January spending, from the revised $1,150.1 billion figure reported last month to $1,122.0 billion with this report; hence the downwardly revised February spending was up from from January, even though it was lower than originally reported...reporters apparently took the change in the MoM percentage change to mean there was an upward change in spending...
even worse than that, the NY Times quoted someone at Barclays in reporting "Barclays thinks the government will revise up its estimate of the economy's growth last quarter to a 0.7 percent annual rate, from its initial 0.5 percent estimate"...we have a $28.1 billion downward revision to January spending, a $10.4 billion downward revision to February spending, and March construction spending that was almost certainly lower in most sectors than was estimated by the BEA, who in their technical notes for 1st quarter GDP, noted they assumed an increase in nonresidential construction, and an increase in residential construction...not even considering what ever the downward revision to assumed March spending might be (GDP investment categories include more than is included in this report) the $38.5 billion downward revisions to January and February alone would subtract more than 0.23 percentage points from GDP, just the opposite of what Barclays is alleged to have forecast....
rjs
other elements into GDP
That might be coming from trade data, notoriously revised on the 1st revision. Also, inventories might be less contraction then originally assumed, but you're right, construction spending goes into GDP and that is a whopper, assuming that's nonresidential.