The effects of the Oil Shock that took prices to $100+/barrel in 2007-2008 are gone now, aren't they?
Before the Black September market/401k meltdown, aside from housing and finance, the chief drag on Main Street was the shock of Oil prices rising relentlessly from $55 dollars/barrel in January 2007 to $147/barrel in July 2008. This was the 4th such Oil Shock, the previous shocks all causing recessions in 1973-74, 1980, and 1990. Last summer people weren't talking about how their retirement accounts had been cut in half, or how unemployment was skyrocketing, they were talking about how it took $50 or $100 to fill up their cars or SUVs. Suddenly mass transit and carpooling were popular again.
For my part, back in March 2008, I predicted that based on past Oil shocks, the price of Oil and the inflation rate would both peak by late summer, and thereafter decline, perhaps even going all the way to deflation by the end of 2008.
During that same period of time, every time there was a retail sales increase, the notion that the consumer hadn't rolled over yet was met with derisive cries that the sales increases only reflected increases in the price of Oil. After July the reverse was claimed.
Last week a Cato Institute pundit went on the Lou Dobbs show and claimed that only Oil-importing countries had gone into deep recessions. (I can't embed the video, but here's the link. Only the first half of the interview is relevant). In other words, the poor economy was still "all about Oil."
Is it? Only one other blogger has (very wonkishly) looked into the issue of how much the Oil shock might still be affecting our economy (more on that below). But the data is there, so I took a look. The results blew me away.
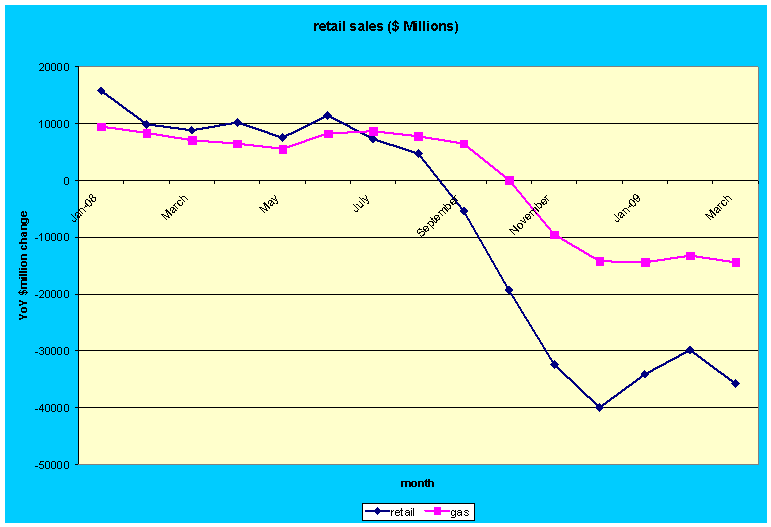
There are two ways to evaluate the claims about at the impact of Oil. First, the claim that increases/decreases in consumer spending primarily or mainly reflect the change in the price of Oil, can be evaluated by looking at the monthly changes in $Millions spent on Oil vs. the entire retail economy. If it's really all about Oil, then we should expect to see sales of gasoline and total retail sales move in the same direction by similar amounts. Here is a graph of that relationship, comparing year over year $millions differences in total retail sales (blue) vs. just Oil (red):

The argument appears to hold for the first part of 2008. Both overall retail sales and gasoline sales moved in the same direction, by at least comparable amounts. After that the relationship broke down. Oil sales decreases came nowhere near total retail decreases, and when the price of Oil picked up again after December, the change was only partially reflected in overall retail sales.
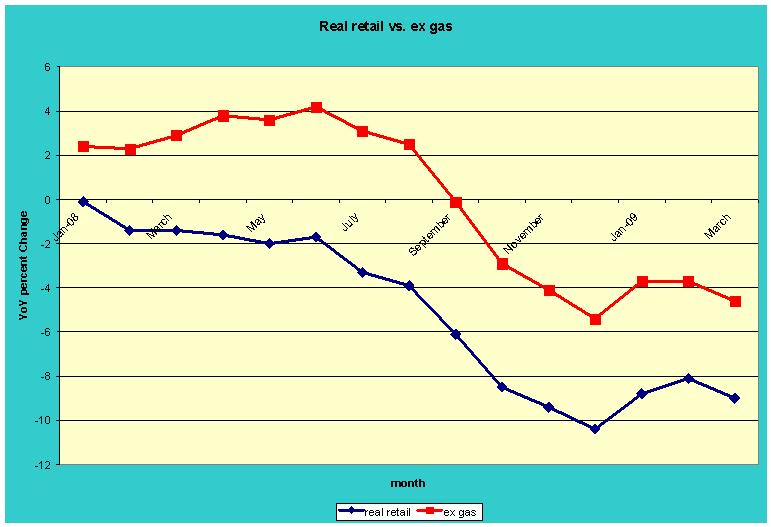
But is/was Oil truly responsible for the changes we have seen over the last year and a half in retail spending? For that, we need to strip out inflation and look at real retail sales. We also need to strip out Oil's influence and see what real retail sales ex-gas look like. Fortunately, we can do that. The BLS helpfully tells us what the inflation rate overall and also for Oil are, and also tells us that motor fuel is accorded an ~5.5% weighting in the CPI index. So all we have to do is subtract Oil from retail sales to find out the remainder, and then adjust each, separately, for inflation to find out the inflation rate for the remaining 94.5% (for example, if the overall inflation rate is 4% but the Oil inflation rate is 20%, then the inflation rate for the remaining 94.5 percent of retail sales is 3.1%). That's what this second graph does. In the below graph, the YoY% change in total real retail sales is in blue; for all items ex-gas, in red.

The way to interpret the above graph is to imagine that both Oil and non-Oil prices have remained unchanging during the entire period. Even so, consumer spending on Oil has decreased from 2% to 5% more than spending on all other goods at all times on a year-over-year basis, right up to the present. Spending on Oil, relatively speaking declined 2-4% more than the remaining spending from 2007 into 2008. More surprisingly, even with the collapse in Oil prices, spending on Oil still declined 3-5% more again from those levels in 2008 into 2009. In other words, not only did Oil have a consistent negative deffect on the economy effect on the way up, that effect was amplified on the way down and continues to this day. Take the Oil Shock out of the equation, and consumer spending stays positive - i.e., no consumer recession - until Black September. Thereafter, Oil continues to account for over half of the decline in real, inflation-adjusted spending and still does so even now!
I'm not the only one who has been surprised by such a result. Prof. James Hamilton, an economist at UCSD, also looked at the causes and consequences of the 2007-2008 Oil Shock. He found that, taking into account the steep price rises that he attributes in part to speculation, his model very closely predicted what actually occurred to GDP, even after Black September. He notes:
My paper uses a number of different models that had been fit to earlier historical episodes to see what they imply about the contribution that the oil shock of 2007-08 might have made to real GDP growth over the last year.... Although the approaches are quite different, they all support a common conclusion: had there been no increase in oil prices between 2007:Q3 and 2008:Q2, the U.S. economy would not have been in a recession over the period 2007:Q4 through 2008:Q3.
....
The implication that almost all of the downturn of 2008 could be attributed to the oil shock is a stronger conclusion than emerged from any of the other models surveyed in my Brookings paper, and is a conclusion that I don't fully believe myself.
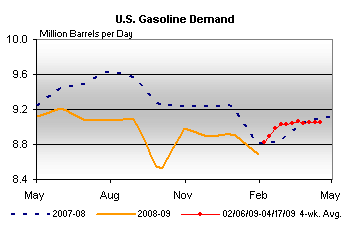
Earlier, Prof. Hamilton had noted that past Oil shocks (pdf) reached the point of maximum statistical impact on consumer behavior 12 months after the shock. Given that Oil consumption, even at multiyear lows for gasoline prices, continues to decline relative to other spending, it appears that behavior is still intact. In fact, here is the latest weekly data from the EIA, showing that gasoline consumption now is less even than the depressed levels of a year ago!

See also this entry yesterday from Calculated Risk regarding traffic volume trends.
Since Oil reached its peak in July 2008, if Prof. Hamilton's research holds true then the impact of the Oil shock on this recession will only begin to decline later this summer and perhaps have completely abated by winter. Prof. Hamilton's notes that his model predicts the following:
For what they're worth, the forecasts from here out from equation (3.8) call for GDP growth rates (annual rate) as follows: 2009:Q1 -2.5%; 2009:Q2 -0.8%; 2009:Q3 +3.9%.
It appears that the pundit from the Cato Institute is at least half right. Despite Prof. Hamilton's, and my own, disbelief, not only did the Oil Shock initially put us into recession, but it continues to be responsible for about half of its severity as measured by consumer spending.
The prediction by Prof. Hamilton's model is also consistent with my previous work on Economic Indicators during the Roaring Twenties and Great Depression, which suggests that if the YoY deflation rate reaches bottom this summer, that will mark the end of the economic downturn and the beginning (in terms of growth of GDP) of at least a temporary recovery.

Comments
oil shock
Do these studies accurately reflect changes in oil consumption related to (dramatically) rising unemployment and the collapsing physical economy?
So many tangential factors are involved in the deflationary collapse that I suspect the relationship, while influential, is not directly causal.
Effect of unemployment
The direct effect of unemployment on use of oil/gas is almost impossible to measure. For example, we know that total nonfarm payrolls have declined about 5% from their peak of 139M to 132M. But how much of their driving was commuting? How much might they have cut down trips to the supermarket or mall?
What about businesses that have closed? How much of that driving has been absorbed by other businesses staying open?
Probably the closest way to examine that is by the total number of miles driven, which was reported on by Calculated Risk yesterday. That report shows February driving down less than 1%. Which, of course, is nowhere near the ~4% difference shown by comparing total real retail sales vs. real retail sales minus gas.
Another thing that might be done would be to compare with the 1981-82 and 1973-74 recessions, but again, how much of those drops is sheer unemployment, and how much would reflect medium-term changes in the use of oil/gas?
I know it's hard to believe, but there are the numbers.
And its not just commuting ...
... there is the downturn in shipping freight for that unemployed capacity involved in producing products and in logistics, and there is the downturn in consumption of petroleum as a chemical feedstock, which is also cyclical.
amazing stuff
how oil can affect an economy so significantly. How about other energy such as heating oil, gas, electric? I think those too spiked up, had rate increases.
The Oil Drum has two current articles on this subject.
Professor Hamilton's work is mentioned over there, as well.
http://netenergy.theoildrum.com/node/5304
Further Evidence of the Influence of Energy on the U.S. Economy
The above article cites Professor Hamilton's study.
http://www.theoildrum.com/node/5326
Further Evidence of the Influence of Energy on the U.S. Economy - Part 2
I already had this one open in another tab when I opened this article!
Thanks
I saw Hamilton's work discussed in an article on The Atlantic's website yesterday as well.
Guess my timing was propitious!