Unemployment is a malleable thing. The official unemployment rate released by the BLS (Bureau of Labor Statistics) excludes those individuals who have not looked for work in the last month and those forced to work part time for economic reasons. In short the official rate (U-3) tends to vastly understate the unemployment rate, creating the impression that things are better than they actually are. For many, years the BLS has released what it calls alternative measures of labor underutilization that provide details of the percentage of workers who would like to work (but haven't actively sought it in the last month) and those working part time for economic reasons at the national level.
However, until very recently, the BLS has not released this data at the state level. That has changed. When we look at this broader unemployment rate at the state level, the picture isn't pretty.
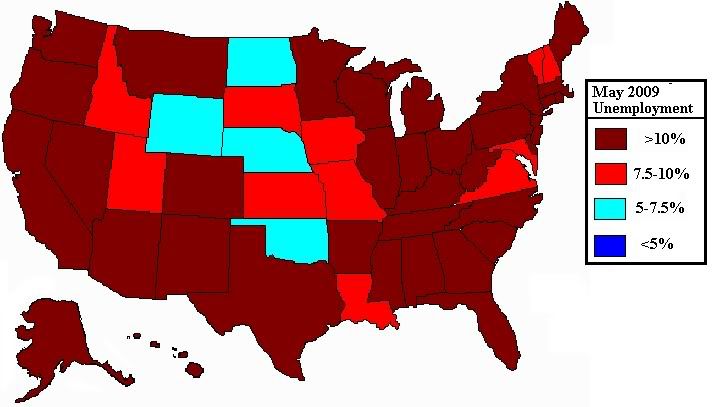
This isn't a conspiracy. The problem is small sample size. The BLS uses surveys with a very large number of participants to drive down the marign of error. So the number that we get at the national level is basically the same that you'd get if you called everyone in the US. But, when you go to the states, the number of participants shrink, and when you include a large number of categories, the margin of error goes up. It's still quite low, just not the gold standard that the BLS has set for national unemployment figures.
This is the reason that until the last year, the BLS did not release alternative measures of labor underutilization for the states. And even now that they have, they are releasing 3 month running averages in order to drive down the margin of error. The problem that creates is that it creates the impression that the "real unemployment" rate (U-6) is much lower than it actually is. The map that I created above shows the running average from the last quarter of 2008 and the first of 2009. Which means that it is lower than what it would be if it gave month by month data.
However, as the BLS notes:
Generally, all six measures move together over time, including across business cycles. Similarly, states that have high official unemployment rates tend to have high values for the other five measures; the reverse is true for states with low unemployment rates.
What this means is that we can build on this observation to build a model.
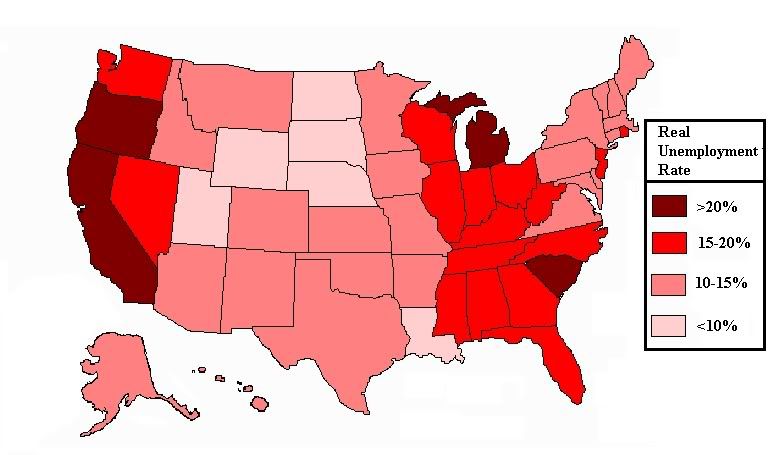
It needs to be stressed that this is only a model, and not something released by the BLS. Because all measures move together over time, we can use the one measure we do have at the state level for May 2009 (U-3, the normal unemployment rate) to estimate the broader "real unemployment" rate at the state level. I did this by dividing the running U-6 "Real" rate by the U-3 "normal" rate. This gives us a proportion. Thus, for example, in Michigan for every 100 person included in the U-3 "normal" rate, there are another 81 that have stopped looking for work, but want it, or working part time for economic reasons. So if we multiply the May 2009 U-3 rate by 1.81 we get an estimate of what the current U-6 rate is.
And we get this map (note that the scale has changed from above):
Or to put it in graph form.
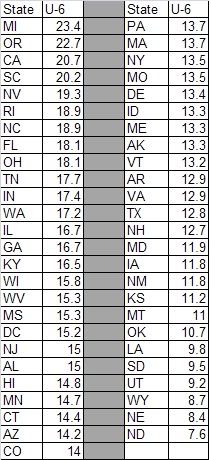
What this model suggests is that the "real" unemployment rate in Michigan is around 23.4%, meaning that 1 in 4 people who want to work are without it in Michigan. This is bad, and only going to get worse. As the impact of the auto shutdowns at GM and Chrysler ripples out the auto states (Indiana, Michigan, Ohio) are going to see this grow much higher.
It's not only this the opportunity to look at this broader rate that makes the new state numbers interesting.
Another interesting point relates to the issue of structural unemployment.
One of the components of the U3 measure tells us what percentage of total workers have been out of work for more than 15 weeks. This is an example of structural employment.
Structural unemployment is much harder to deal with than short term unemployment. After all, as bad as being unemployed is, it's one thing to have no job for 4 weeks. It's another if you're out of work for 4 months. In the short term, people can drawn down on savings. With structural unemployment lives are shattered, houses are lost, and all to often lives are taken to escape the feeling of loss that comes with having no hope of finding work and running out of options.
When we look at the percentage of workers included in the U-3 "normal" unemployment rate that have been out of work for more than 15 weeks, the numbers are high nationally, and higher in some states. Since this time last year at the national level, structural unemployment has increased from around 33% to around 45%. I am working with running averages for the Q4 2008 and Q1 2009, so the state numbers I'm going to show are most likely a lot lower than they are now. But there's really no way to tell the current rate.
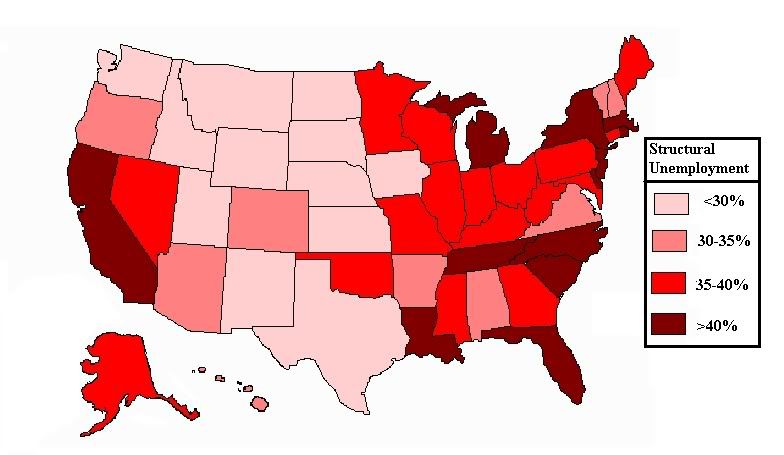
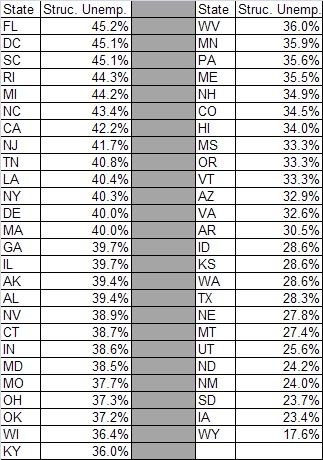
As you can see, in general the higher the U3 rate, the higher than structural unemployment is as a percentage of it.
The consequences of this are dramatic.
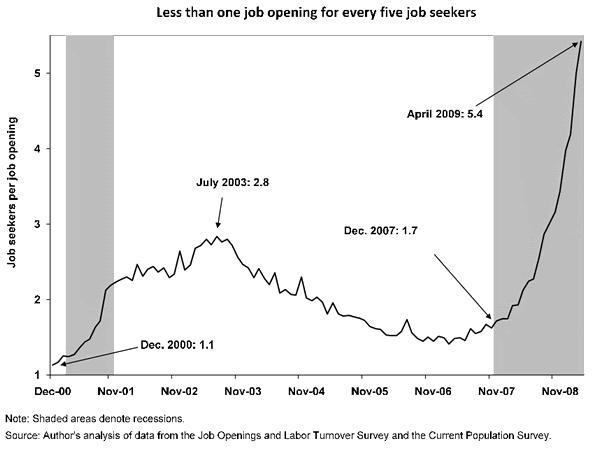
A recent report from the Economic Policy Institute (EPI) points out that there are 5 unemployed workers for every current job opening.
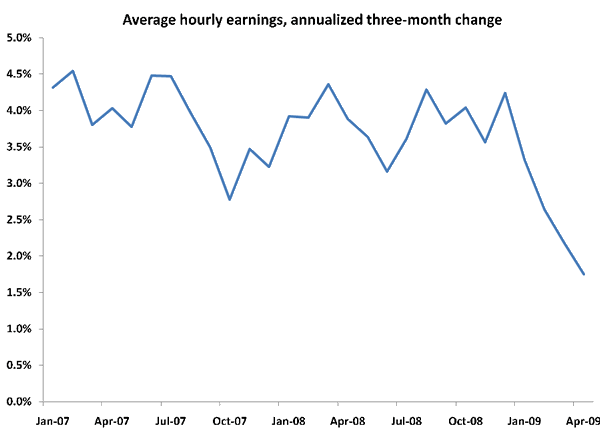
Further, this glut of workers willing to take jobs has contributed to wage implosion.
These trends are going to lead to more trouble down the road. Right now workers are spending down on their savings, but the real crisis is going to hit when families with out of work breadwinners have nothing left to support themselves with. There is another wave of mortgage and credit defaults in the making here. And when it hits, it's going to have a far broader impact than those that hit last fall.

Comments
scary maps indeed
Great graphics middle.
They really need to change the way unemployment statistics are tabulated, that's the bottom line.
It's like they are designed to hide bad news instead of accurately reporting the state of employment in America.
For professionals, I mean you can get shut out of your occupational area and the way they calculate the stats, you plain will not show up.
You really have to almost write up a research paper to calculate:
# of PhDs in Chemistry working for < $10 hr.
as an example.
It is designed to hide bad news
the 1994 redesign of the CPS shoved people who hadn't actively looked for a job in the last month out of the unemployed category.
When you're talking about professionals, they often aren't going to find a job that matches their skill set to apply for every month.
Not to mention that many people are forced to take a part time job at much lower pay. So what happens is that the unemployment rate doesn't include them even though they are still really without job.
You know what I'm talking about college graduates working at the local library 20 hours a week for minimum wage.
New Deal Democrat
has written some excellent posts comparing data from the Great Depression to now, but a post on the history of the unemployment stats is most needed.
Most do not realize the changes over time to do what you are saying.
Even worse, I tried to compare to other nation's stats and I never came up with an true scale, the differences.
Be a huge educational thing if you know all of this and wrote it up.
During commuting hours
SE MI highways are almost empty. Traffic almost doesn't exist, unless it is construction. Once school is out, there will be even less on the roads.
They keep giving us job training money when there are no jobs. We need to do a version of Carter's public service employment for the LTU. The ARRA money will create "summer jobs" for kids, but the adults are pretty high and dry.
Edward E. Whitacre, Jr. & GM
It's interesting that Edward E. Whitacre, Jr. has been named Chairman of General Motors now. As a member of the board of directors of the Peterson Institute for International Economics, he brings along that 'tute's long-term agenda for offshoring American jobs and privatizing social security, no doubt!
Unemployment and the motivation gap
Speaking of the employment situation, Junior Achievement just put out a new report about how the country needs a more "Entrepreneurial Workforce" to remain competitive. It's kind of a different way of looking at the problem. Here's the link http://www.ja.org/files/The_Entrepreneurial_Workforce_full-11.pdf.
Memo from State of MI
Between May - December of 2009, 99,050 people in Michigan will exhaust their Unemployment Compensation benefits. They have only one place to go and that's welfare. Meanwhile , welfare programs are being slashed and Clinton's TANF program, made worse by Bush, requiring welfare recipients to sit in job search programs/centers for up to 30 hours a week hasn't been waived for this state. Nothing has been waived for this state. All of the job training money they are giving to us still requires a 97% entered employment rate after training. On which GD planet!
YES WE CAN doesn't necessarily mean he will.
Im fortunate for today to
Im fortunate for today to have employment. But living and working in one of the highest economically challenged counties in Florida can take its toll. Daily I see more and more people standing on corners begging for money and not even just men anymore, but whole families.
I cant help but think so much more could have been done to help the unemployed and build new job markets if the president would allow drilling for oil around the country. yes, we need an alternative source, but in the meantime we need oil now and we need to break our dependence on the middle east oil barons.
economics
Id like to know or see comparisons of the economy before all the stimulus and cash for clunkers etc and now after the fact and see if it had any effect on the average american family. Im of the mindset that only the executives in big business came out ahead from these plans. If a family cant afford to pay their mortgage and put food on the table what good is trading their car in for a newer one going to do?
The picture is horrifying.
The picture is horrifying. Is it due to the recent recession? The maps speak about the current situation of unemployment in Michigan. But we need to think that what percentage of this unemployment is seasonal unemployment. As because it affects economy for a very short period of time and is very natural to occur, we need not be that much worried about that. The rest, I hope time will heal the recession thing pretty soon.