Some Green Shoots supporters have declared that the bottom is in. They point towards various short-term trends, and if you don't look too close, it appears to support their cause.
The Green Shoots supporters accuse the Brown Weeds advocates of using charts that are too long, and thus miss the recent movements.
Therefore I've decided to dig up my own charts, looking at just the last month.

The stock market, supposedly the most "forward-looking" of indexes, has been looking rather sickly during the past month. If you were taking votes, the stock market has given the near future a "thumbs down" for the economy.
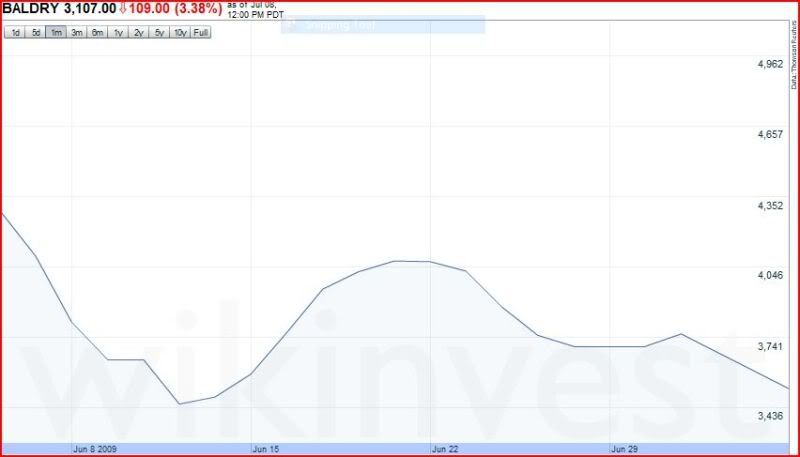
The Baltic Dry Index, the global measure of shipping goods around the world, is also falling. While this is more of an indicator of the global economy, rather than the domestic economy, it nevertheless effects all of us.
On a more domestic indicator, rail freight was down 19.7% in the last month. Why does that matter to you?
“Whenever Americans grow something, eat something, mine something, make something, turn on a light, or get dressed, freight railroads are probably involved somewhere along the line,” said AAR Senior Vice President John T. Gray. “Unfortunately, right now there’s not enough mining , manufacturing and buying going on. So railroads, like most other business sectors, are suffering because of it.”
The unemployment initial claims report came out today, and the headline sounded positive.
(Bloomberg) -- The number of Americans filing claims for unemployment benefits fell last week to the lowest since January, as early automotive plant closures altered the timing of layoffs that typically happen at this time of year.Initial jobless claims fell by 52,000 to 565,000, a lower level than forecast, in the week ended July 4, from a revised 617,000 the prior week, the Labor Department said today in Washington. Meanwhile, the number of people collecting unemployment insurance jumped to a record in the prior week.
Boy, once you get past the headline that sounds absolutely gloomy.
But, wait. What did it say about early automotive plan closures?
It never occurred to me before that the unemployment initial claims numbers would be seasonally adjusted. After all, what does a seasonally adjusted pink slip look like? Can a person only lose their job during months that start with a "J" or an "M"? Obviously the real numbers are unadjusted, while the seasonal numbers are meant to be put "into context".
So what do the non-seasonally adjusted numbers look like?
| Initial UI claims | July 4 | June 27 | June 20 | June 13 |
| No Seasonal Adjustment | 577,506 | 559,894 | 568,552 | 558,407 |
| Seasonally Adjusted | 565,000 | 617,000 | 630,000 | 612,000 |
Notice how the unadjusted numbers have a rising trend, while the adjusted numbers, the ones the media reports, have a distinct downward trend.
To this point, Green Shooters are likely to point out what happened in previous months, where initial unemployment claims were higher. And that is exactly where I want them to go, because if you start looking at longer trends then the Green Shoots theory falls apart.
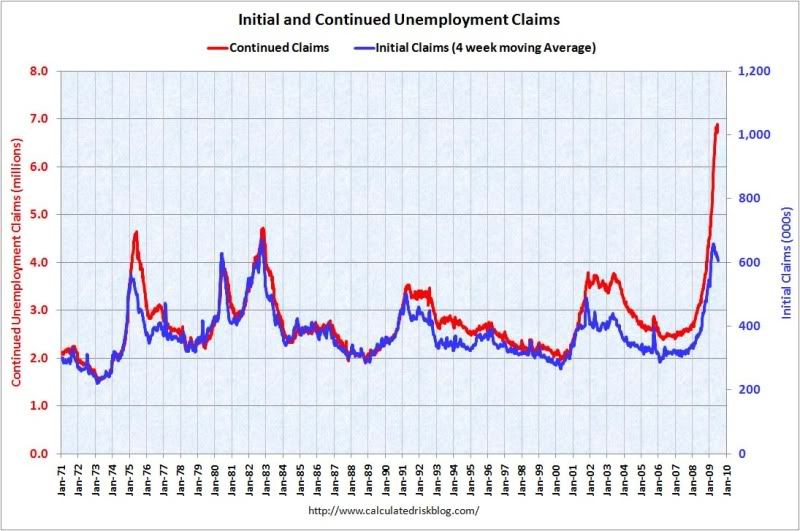
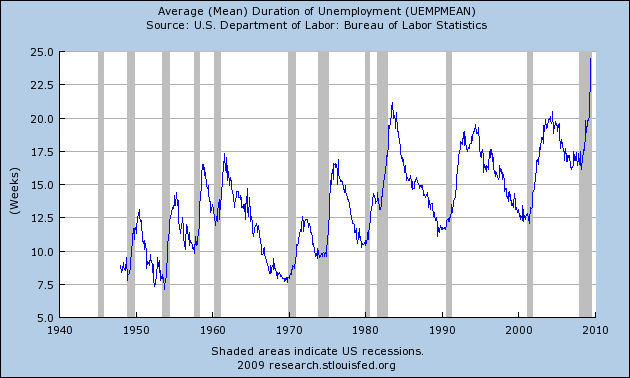
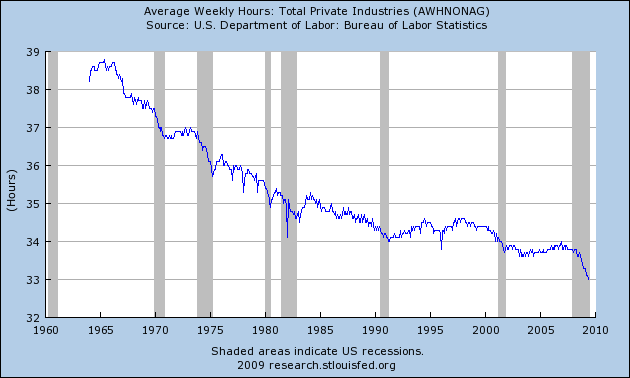
No Green Shoots here. Just Brown Weeds.
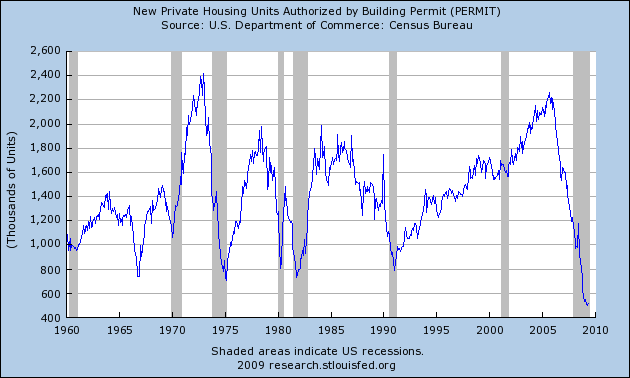
Of course you can't talk about the economy these days without mentioning the housing sector (unless you only want to talk about Green Shoots).
Rep. Carolyn Maloney used an alarming phrase yesterday.
"The commercial real estate time bomb is ticking," Joint Economic Committee Chairman Rep. Carolyn Maloney, D-N.Y., said in opening remarks to a hearing before her panel Thursday.
Why would she say something like that? Because $400 Billion in commercial real estate debt is coming due this year, and since prices have fallen about 24% since 2007, the chances of refinancing most of it are slim at best.
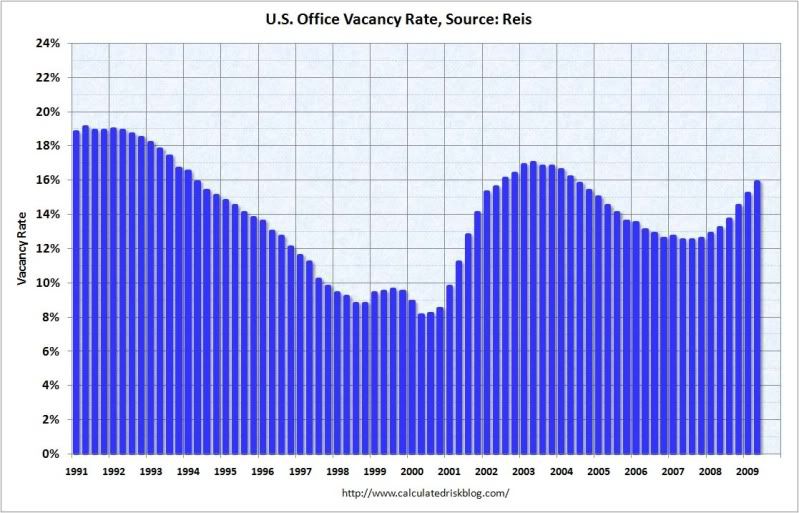
This is especially troubling for the banking system, which carries most of this debt on their books. How troubling is it? Take a look.
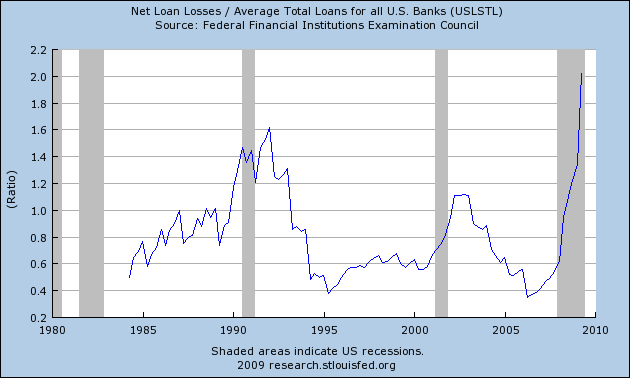
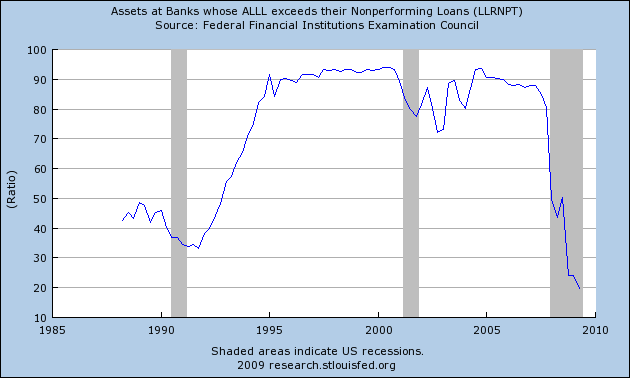
Quite simply, these are scary charts. If the taxpayer wasn't backstopping the entire banking system it would have already failed. If it wasn't for the Green Shoots stock market rally from March to June, our banking system simply wouldn't have any capital to cover its losses.
It begs the question: what will happen to the banking system when the commercial real estate market implodes during the 2nd half of the year?
So what has those zombie banks done with all those taxpayer bailouts? They bought treasuries with it. None of it was returned to the real economy.
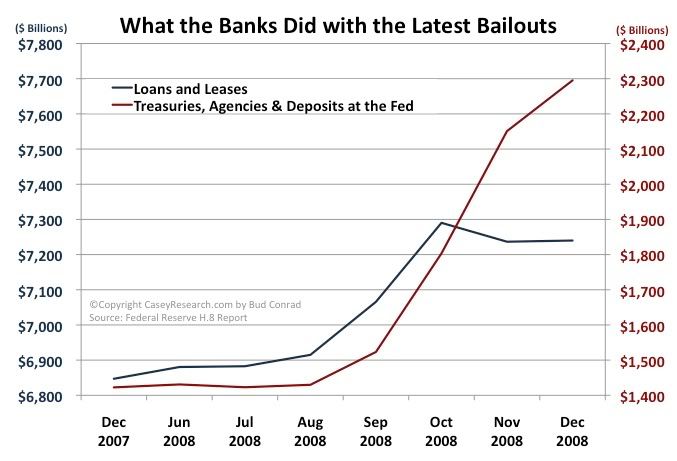
If you look hard enough you can find Green Shoots, but do they actually exist in the real world? Sadly, no.
Until the economy can expunge the massive amounts of debt that saturates every crevice, there will be no Green Shoots.

Comments
the green shoots and brown weeds debate continues!
I saw bonddad's post and esp. on Huffpo, oh boy is he getting rebuttal!
Maybe NDD will show up, I've fairly certain he's in the green shoots camp, although with a more realistic view this ain't gonna be no "V".
How about green shoots that are being choked with debt and globalization weeds? i.e. a massive mud puddle, that's my vote. Lots of seeds being planted, then drown out in a huge mess and why this debate is raging.
Some counterpoints
1. Stock market is measured over 90 days as an LEI. Apr-June was up. May-July will be challenging and may be down.
2.Baltic Dry Index is down, mainly because Chinese stopped stockpiling and Oil tankers are coming to port. (Oil has fallen from $74 to $60 in the last month as a result)
3.Rail traffic was NOT down 19.7% in the last month. It was down 19.7% compared with the same month last year. A very lagging way of looking at rail traffic. It actually did decline slightly last week, but the recent 13 week trend has been up.
4. Care to post the non-seasonally adjusted initial jobless claims from the weeks surrounding July 4 for the last 5 years? In each case the July 4 week was up dramatically. This week it was up slightly. And funny, I don't remember hearing anyone say the initial claims number was "artificially high" during the Chrysler and GM plant closures. If you're going to make that claim, then you have to adjust all of the numbers -- with the net result that the 4 week moving average is virtually identical.
5. Continued claims tend to peak at the end of or just after the end of recessions. Since about 6 weeks ago, continued claims have been moving basically sideways. Post the graph for the last 3-6 months and it is easy to see.
6. Average weekly hours at private plants is down. Average weekly hours at manufacturing is sideways for the last ~4 months. That's the leading indicator, not your graph.
7. Housing permits are still declining, but the rate of decline looks less (for the first time in a long time). The best evidence we have is that housing starts didn't bottom until 1935 in the GD. So we can have growth even if housing starts haven't hit bottom yet.
8. Per Calculated Risk, CRE is the last aspect of real estate to turn, lagging personal real estate by about 6 quarters. A lagging indicator, no surprise that it is still tanking.
9. Your graphs of loans clearly shows that they bottom AFTER recessions end. That they haven't bottomed tells us that we didn't exit the recession a few months ago.
I have to leave for a few days. Have a nice weekend.
Counters to counterpoints
1. So? Exactly why do Green Shooters get to set all the time frames for how long we should look at indexes?
2. So you say. We shall soon see if that is true.
3. My bad. It was a misstatement. Nevertheless, you are including an early year spike in that 13 weeks. If you look at just the last couple months it is flat to down.
4. Glad you brought that up, because the seasonal adjustment has traditionally been for temporary closing. Now we have permanent closings. Get ready for a HUGE spike in UI claims later this year. How's that going to help your Green Shoots?
5. Who says that claims have peaked?
6. I don't consider manufacturing at a public industry to be a leading indicator.
7. A punch in the mouth is better than a poke in the eye with a sharp stick, but neither is an indicator of good times to come.
8. We've never had a banking sector so weak as we do now. This could easily cause additional problems. For instance, the cost of corporate debt insurance is hitting multi-month highs.
9. They tell us something else too - that we are in uncharted territory.
What is Plan "C"?
Despite the efforts of Geithner/Summers, this House of Cards cannot be rebuilt. It is time to hit reset.
We need more creative solutions to these problems instead of the same old thinking that got us into this mess.
RebelCapitalist.com - Financial Information for the Rest of Us.
On Target
Exactly!
"Why would she say something like that? Because $400 Billion in commercial real estate debt is coming due this year, and since prices have fallen about 24% since 2007, the chances of refinancing most of it are slim at best."
And that $400 billion is super-leveraged in the form of CLOs, etc., to the tune of who-knows-how-many trillions?
This Goldman Sachs architected stimulus plan is pathetic, and even when more than the reported 15% makes its way out the door, it will have little or no impact whatsoever on an economy based upon financialization.
650,000 will exhaust Unemployment Comp.
in 3 months. This is a big problem. People are not ready for such extended long-term unemployment.
The questions is whether what will be the new level of structural unemployment. This may have huge socio-economic impact.
Obama’s Jobless Safety Net Torn by 48-Year-Old Rebecca Alvarez
RebelCapitalist.com - Financial Information for the Rest of Us.
More brown weeds choking out green shoots
Consumer Sentiment Index Falls to 64.6
Robert Reich: When Will The Recovery Begin? Never.
Excellent blogpost by Reich