
The September 2012 S&P Case Shiller home price index shows a 3.0% price increase from a year ago for over 20 metropolitan housing markets and a 2.1% change for the top 10 housing markets from September 2011. Not seasonally adjusted home prices are now comparable to September 2003 levels for the composite-20 and Octber 2003 for the composite-10. That said, wages are flat and millions are without work which implies housing is on the path to being not affordable. Below is the yearly percent change in the composite-10 and composite-20 Case-Shiller Indices, not seasonally adjusted.

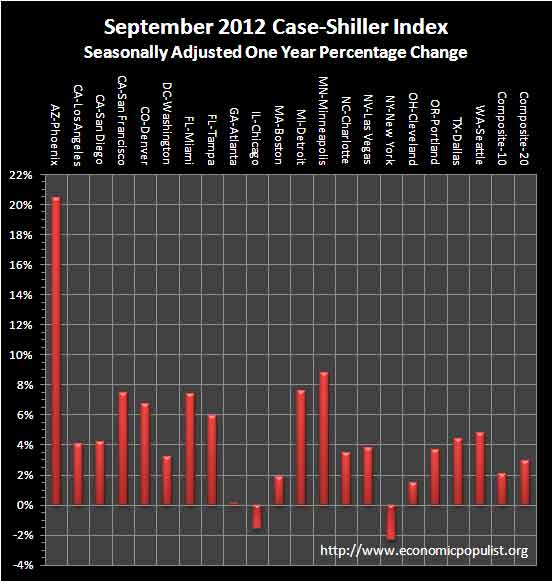
Below are all of the composite-20 index cities yearly price percentage change, using the seasonally adjusted data. We see Phoenix soaring, up 20.4% from a year ago and Chicago down 1.6%, New York down -2.3% and the hemorrhaging in Atlanta abated at a yearly percentage change of 0.1%. Using the seasonally adjusted data, the composite-20 yearly percentage change was 3.0% and the composite-10 yearly percentage change was 2.1%.
S&P reports the not seasonally adjusted data for their headlines. Housing is highly cyclical. Spring and early Summer are when most sales occur. See the bottom of this article for their reasoning.
S&P also produces a third national index. S&P is using the not seasonally adjusted national index when they report Q3 home values are up 3.6% from Q3 2011. Seasonally adjusted the quarterly change from a year ago is 3.7%. Below is the national index, not seasonally adjusted (blue), which are used as the headline numbers, against the seasonally adjusted one (maroon).

Below is the Q3 2012 percent change against Q3 2011. The seasonally adjusted change was 1.1% from Q2 2012 to Q3 2012. From Q1 2012 to Q12 2012 the change was 2.4%, seasonally adjusted. That's quite the difference from the not seasonally adjusted Q2 to Q3 2012 change of 2.2% and Q1 to Q2 2012 not seasonally adjusted change of 7.1% that is reported in the headlines.

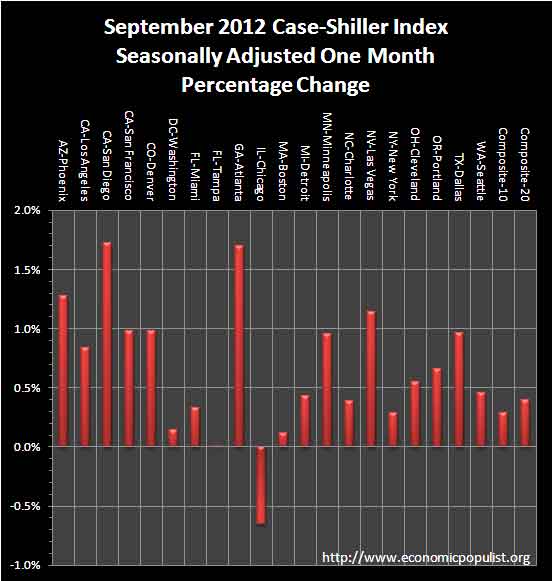
For the month, the not seasonally adjusted composite-20 percentage change was 0.3% whereas the seasonally adjusted change for the composite-20 was 0.4%. The monthly not seasonally adjusted composite-10 percentage change was 0.3%, whereas the seasonally adjusted composite-10 showed a 0.3% increase. Both are positive, but this is the end of the buying season, so no surprise the seasonally adjusted and not seasonally adjusted figures more match.

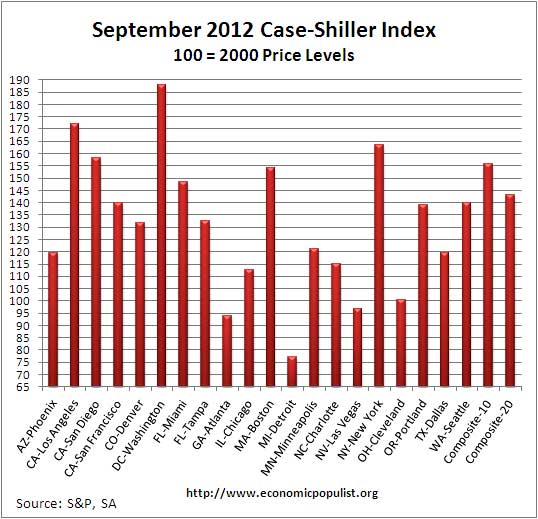
The above graph shows the composite-10 and composite-20 city home prices indexes, seasonally adjusted. Prices are normalized to the year 2000. The index value of 150 means single family housing prices have appreciated, or increased 50% since 2000 in that particular region. These indices are not adjusted for inflation.
News headlines on the S&P Case-Shiller Housing Index often differ. Some in the press use the seasonally adjusted data, and others do not. Some report the monthly change, others the annual change. S&P themselves use the not seasonally adjusted housing price data. To make matters worse, some in the press do not specify which statistic they are quoting from S&P. Below are the seasonally adjusted monthly home price percentage changes for each City reported by S&P.
Below are the seasonally adjusted indices for this month. Folks spin these indexes with percentages while the index itself tells you what has happened to home prices, per city, from the year 2000.
Either way you look at this month's data, most metropolitan area housing prices seem to be increasing. From the S&P press release, using the not seasonally adjusted home price indices, S&P is saying the housing prices has increased for the last six months. While this is great news showing the housing collapse is over, in terms of affordability for working families, it's really not. One simply cannot afford even a $200,000 mortgage when a household earns $42,000 a year.
We are entering the seasonally weak part of the year. The headline figures, which are not seasonally adjusted, showed five cities with lower prices in September versus only one in August; in the seasonally adjusted data the pattern was reversed: one city fell in September versus two in August. Despite the seasons, housing continues to improve. “Phoenix continues to lead the recovery with a +20.4% annual growth rate. Atlanta has finally reversed 26 months of annual declines with a +0.1% annual rate as observed in September’s housing data.
To Season or Not to Season, That is the Question:
The S&P/Case-Shiller Home Price Indices are calculated monthly using a three-month moving average and published with a two month lag. Their seasonal adjustment calculation is the standard used for all seasonal adjustments, the X-12 ARIMA, maintained by the Census.
So, why would S&P report the not seasonally adjusted data? According to their paper on seasonal adjustments, they claim the not seasonally adjusted indices are more accurate. It appears the housing bubble burst screwed up the cyclical seasonal pattern. What a surprise, although those steep cliff dives are now going back to 2009, one would think the seasonally adjusted data would now start to converge back to it's cyclical, seasonal pattern.
The turmoil in the housing market in the last few years has generated unusual movements that are easily mistaken for shifts in the normal seasonal patterns, resulting in larger seasonal adjustments and misleading results.
To see S&P's argument in action, look at the below graph. The maroon line is the seasonally adjusted national index, reported quarterly. The blue line is the not seasonally adjusted national index. As we can see before the housing bubble burst, we see a typical cyclical pattern difference between the seasonally adjusted and not seasonally adjusted data points. Yet after the bubble burst we see large swings, which would throw off a seasonal adjustment adaptive algorithm. This is going to become a major question among statisticians, how does one adjust for seasonality in the face of tsunami like economic events?

Not seasonally adjusted data can create more headline buzz on a month by month basis due to the seasonality of the housing market. S&P does make it clear that data should be compared to a year ago, to remove seasonal patterns, yet claims monthly percentage changes should use not seasonally adjusted indices and data. This seems more invalid than dealing with the statistical anomalies the massive housing bubble burst caused. Below is the seasonally adjusted and not seasonally adjusted Composite-20 Case-Shiller monthly index.

For more Information:
S&P does a great job of making the Case-Shiller data and details available for further information and analysis on their website.
Here is our Case-Shiller past overviews.
Recent comments