
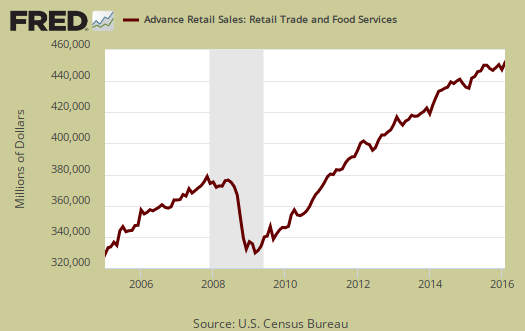
The February 2016 Retail Sales report shows retail sales decreased -0.1% for the month as gasoline sales plunged by -4.4%. Without autos & parts sales, retail sales still decreased by -0.1%. Gasoline sales have dropped -15.6% from a year ago. Declining gasoline sales are once again responsible for the disappointing figures, as without gas stations considered, retail sales increased by a modest 0.2%. Retail sales have now increased 3.1% from a year ago. Retail sales are reported by dollars, not by volume with price changes removed. Retail trade sales are retail sales minus food and beverage services and trade sales dropped by -0.3% for the month. Retail trade sales includes gas and have increased 2.7% from a year ago.
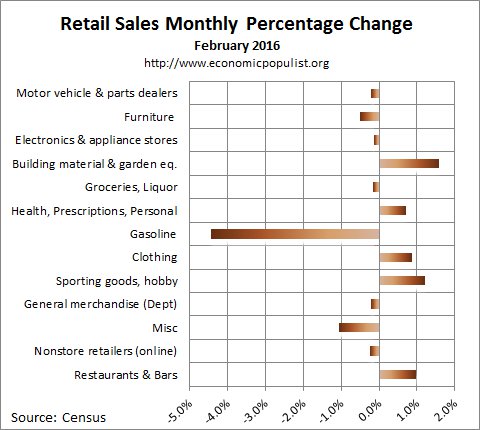
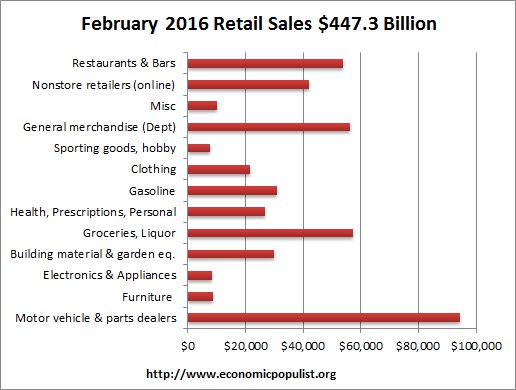
Total February retail sales were $447.3 billion. Below are the retail sales categories monthly percentage changes. These numbers are seasonally adjusted. General Merchandise includes Walmart, super centers, Costco and so on. Department stores by themselves saw no change from last month, not good news for them during the start of Holiday shopping. Grocery stores by themselves showed a -0.3% monthly sales decrease. Building materials and garden supply places had a great month with a 1.6% monthly gain. Sporting goods also had a good month with a 1.2% increase and are up 6.7% for the year. Restaurants and bars also had a good showing with a 1.0% increase and are up 6.4% for the year. Miscellaneous brick and mortar store retailers had a miserable month with a -1.1% decline in sales. Departments stores, part of the general merchandise category, declined by -0.4%. Online shopping actually declined by -0.2% for the month, but is up 6.3% for the year.
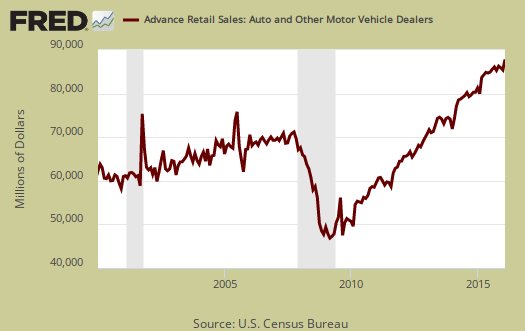
Below is a graph of just auto sales. For the year, motor vehicle sales have increased 7.1%. Autos & parts together have increased 6.8% from a year ago.
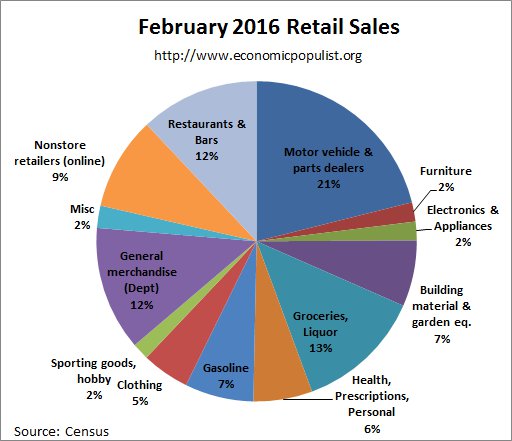
Below are the retail sales categories by dollar amounts. As we can see, autos are by far the largest amount of retail sales. Yes folks, in spite of the great smartphone revolution, the automobile remains king.
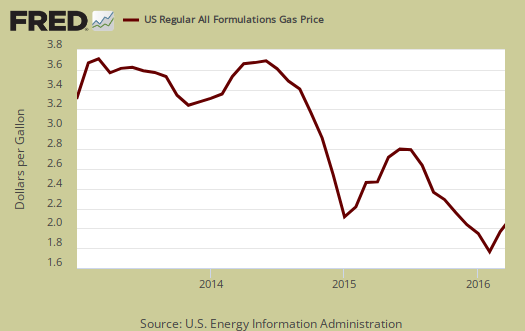
Graphed below are weekly regular gasoline prices, which is strongly correlated to retail sales figures.
The below pie chart breaks down the monthly seasonally adjusted retail sales by category as a percentage of total sales by dollar amounts.
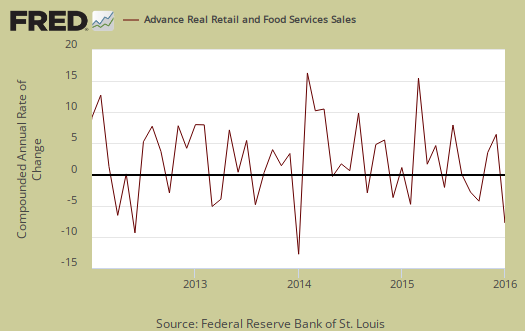
Retail sales correlates to personal consumption, which in turn is about 70% of GDP growth. Yet GDP has inflation removed from it's numbers. This is why Wall Street jumps on these retail sales figures. Below is the graph of retail sales in real dollars, or adjusted for inflation, so one gets a sense of volume versus price increases. Below is the annualized monthly percentage change in real retail sales, monthly, up to January 2016. This is a crude estimate since CPI is used instead of individual category inflation indexes.
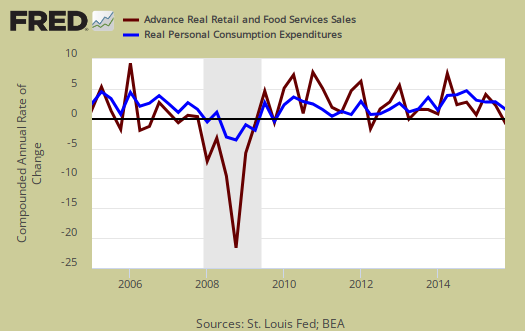
Below is a graph of real PCE against real retail sales, quarterly, up to Q4 2015. See how closely the two track each other? PCE almost looks like a low pass filter, an averaging, removal of "spikes", of real retail sales. Here are our overviews for PCE. Here are our overviews of GDP.
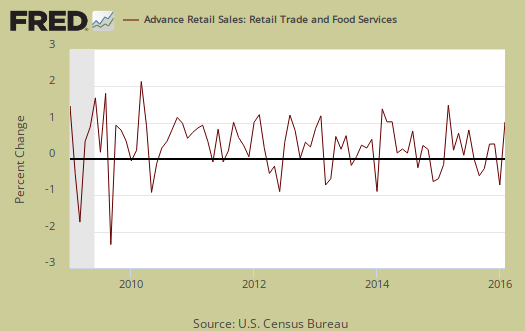
Retail sales are not adjusted for price increases, not reported in real dollars. Real economic growth adjusts for inflation. Retail sales has variance, margins of error, and is often revised as more raw data comes into the U.S. Department of Commerce (Census division). For example, this report has an error margin of ±0.5%. Data is reported via surveys, and is net revenues of retail stores, outlets. Online retail net revenues are asked in a separate survey of large retail companies (big box marts). This is also the advanced report. To keep the monthly nominal percentage changes in perspective, below is the graph of monthly percentage changes of retail sales since 2009.
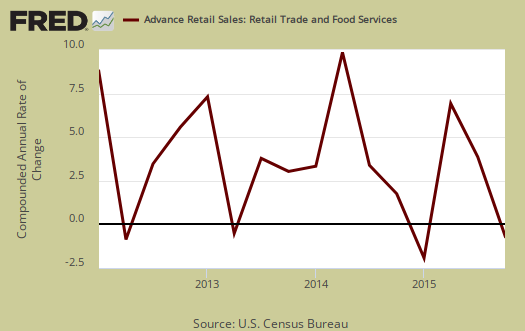
For the three month moving average, from February to December in comparison to the September to November average, retail sales have increased by 02%, which implies continuing slow molasses sales. The retail sales three month moving average in comparison to a year ago is up a much better 2.9%. Overall as shown the below graph of quarterly annualized retail sales percentage change, up to Q4 2015. Adjusted for prices and inflation is what matters for economic growth.
Advance reports almost always are revised the next month as more raw sales data is collected by the Census. In other words, do not get married to these figures, they will surely be revised and seasonal adjustments are aggregate.
Here are past retail sales overviews, not revised.
Recent comments