
The NAR released their April 2012 Existing Home Sales report.
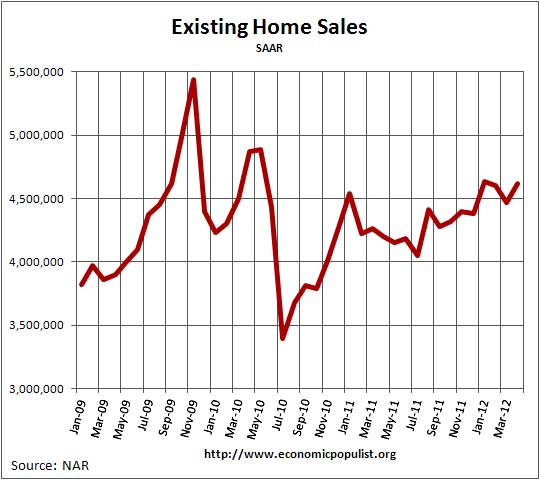
Total existing-home sales, which are completed transactions that include single-family homes, townhomes, condominiums and co-ops, increased 3.4 percent to a seasonally adjusted annual rate of 4.62 million in April from a downwardly revised 4.47 million in March, and are 10.0 percent higher than the 4.20 million-unit level in April 2011.
One of the most amusing things from NAR is their never ending drum beat that a housing recovery is on the way, as if existing home sale levels comparable to 2009 are a housing recovery. Look at their press release:
Lawrence Yun, NAR chief economist, said the housing recovery is underway. “It is no longer just the investors who are taking advantage of high affordability conditions. A return of normal home buying for occupancy is helping home sales across all price points, and now the recovery appears to be extending to home prices,” he said. “The general downtrend in both listed and shadow inventory has shifted from a buyers’ market to one that is much more balanced, but in some areas it has become a seller’s market.”
Is that in anyway shape or form, reality to you? There is no way housing prices are going to magically balloon up to 2006 levels, not with the high unemployment rate and repressed wages. More realistically we are seeing a very modest improvement from the housing bottoms of 2008, 2009 and it appears a modest recovery pattern is in play.
So, why is the NAR pushing yet another warm fuzzy? Their estimates for home prices shot up for April along with reports of short supply in housing for Washington, D.C., area; Miami; Naples, Fla.; North Dakota; Phoenix; Orange County, Calif.; and Seattle.
The national median existing-home price3 for all housing types jumped 10.1 percent to $177,400 in April from a year ago; the March price showed an upwardly revised 3.1 percent annual improvement. “This is the first time we’ve had back-to-back price increases from a year earlier since June and July of 2010 when the gains were less than one percent,” Yun said. “For the year we’re looking for a modest overall price gain of 1.0 to 2.0 percent, with stronger improvement in 2013.”
Really? Most other price indicators do not predict such a bump up on home prices and others are predicting a a few markets to rise, modestly. Case-Shiller is predicting further declines in home prices and their report is out next Tuesday.
The median price can also be pushed up by less low end foreclose sales, not mentioned by NAR. The average price was $225,700, an increase of 7.4% from last year. March's average existing home sales price was $212,100.
On inventories, we have an national increase, but inventories are highly seasonal.
Total housing inventory at the end of April rose 9.5 percent to 2.54 million existing homes available for sale, a seasonal increase which represents a 6.6-month supply at the current sales pace, up from a 6.2-month supply in March.
Foreclosures and short sales were 28% of April existing homes sales. The breakdown was 17% were foreclosure sales and 11% were short sales. Cash buyers were 29% of all sales with investors being 20% of those cash sales. First time home buyers were 35% of all sales.
Calculated Risk has some commentary on existing home sales inventory.
Today’s report continued the trend for the NAR’s inventory estimates to show significantly lower monthly gains (or larger declines) in March and significantly larger monthly gains in April than that suggested by actual listings data.
Calculated Risk also has FHA REO data and expects foreclosure sales to increase later this year due to the increase in mortgage delinquencies.
The number of SF properties “conveyed” to FHA has been surprising low over the last year given the number of properties in the foreclosure process, and FHA had noted that servicing “issues” were artificially depressing conveyances. Obviously, that was not the case in March!
Even though REO inventories are down, there are still more distressed sales coming because of all the loans 90+ days delinquent and in the foreclosure process.
We recommend Calculated Risk for more details, analysis on existing home sales. CR maintains data graphs going back to year 2000.
As far as the press goes, Market Watch also reports housing data accurately and quotes a series of other economists, who usually either contradict or temper down whatever NAR claims each month.
Recent comments