
August New Residential Single Family Home Sales declined by -0.3%, or 373,000 annualized sales. July's single family new home sales were not revised from their 3.6% increase. The August monthly percentage change has a ±9.3% error margin and this is why we see large revisions to new home sales figures. In other words, don't get too attached to the monthly percentage changes for odds are they will be revised.
New single family home sales are now 27.7% above August 2011 levels, but this figure has a ±18.8% margin of error. A year ago new home sales were 292,000. Sales figures are annualized and represent what the yearly volume would be if just that month's rate were applied to the entire year. These figures are seasonally adjusted as well.
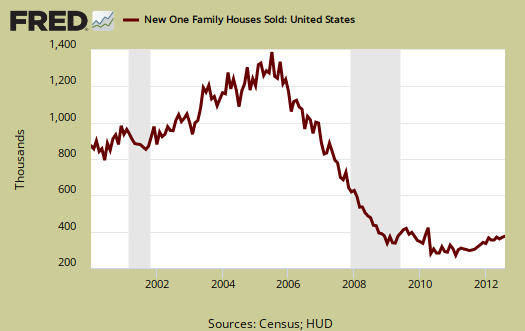
The regional South is why new home sales declined with those regional sales dropping -4.9%. The Northeast region climbed 20.0%, but has a ±43.6% error margin for the monthly change. This just tells us the data on new home sales is not so reliable and it's best to look at the yearly percentage changes.
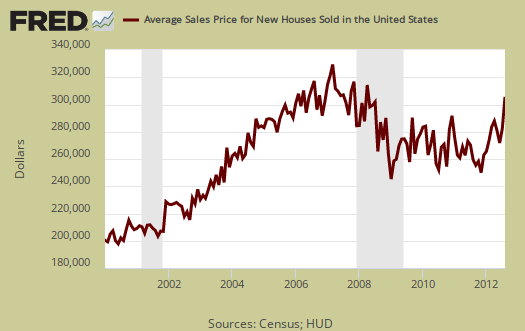
Prices really jumped in August. The average home sale price was $295,300, a 9.1% increase from last month's $270,600 average price. That said, home prices were significantly revised lower for the last three previous months.
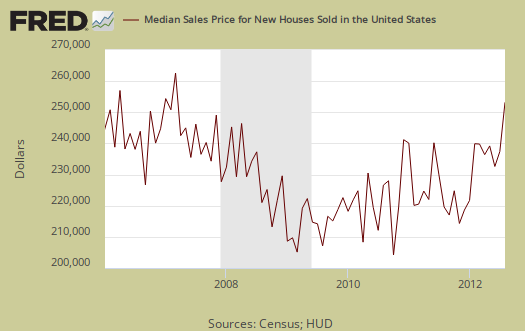
August's median price was $256,900, whereas July's median price was $231,100, a 11.2% monthly jump. Median means half of new homes were sold below this price and both the average and median sales price for single family homes is not seasonally adjusted.
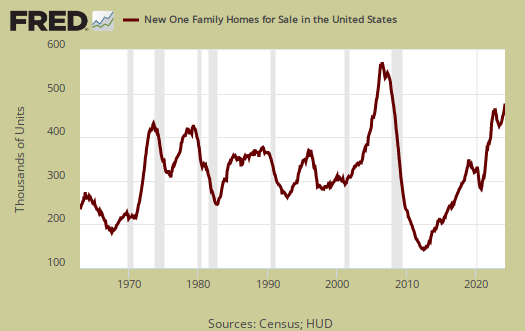
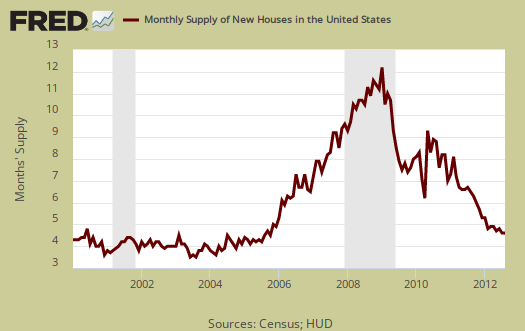
The current supply of new homes on the market is 141,000, annualized and would now take 4.5 months to sell. This is no change from last month's revised inventory figures. The amount of new homes for sale was 141,000 units, annualized and seasonally adjusted. From a year ago housing inventory has declined -31.8% and is above the margin of error.
Below is a graph of the months it would take to sell the new homes on the market at each month's sales rate. We can see these inventories vs. sales times have dropped dramatically from a year ago.
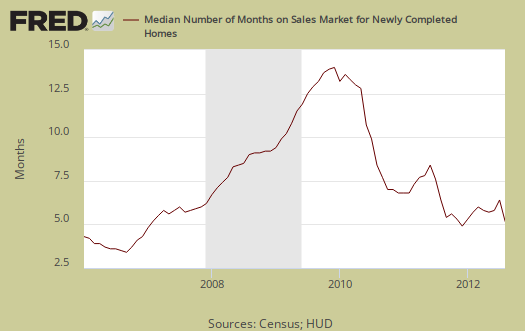
The median time a house was completed and on the market for sale to the time it sold was 8.3 months.
The variance in monthly housing sales statistics is so large, in part, due to the actual volume declining, along with the fact this is a survey. One needs to look at least a quarter to get a real feel for new home sales, but a year of sales data is more in order. Additionally this report, due to it's huge margin of error, is almost always revised significantly the next month. Buyer beware on month to month comparisons and reacting to primarily figures.
What we know about new homes sales is a bottom does seem to have been hit for the change from a year ago, yet we present graphs so one can see these figures are similar to 2010, years after the bubble pop. We list the margins of error for they are usually above the monthly reported percentage changes. The Census notes that the average revision is about 5% of the original reported.
Here is last month's new home sales overview, only graphs revised.
Recent comments