
Q4 GDP 2010 was revised up to 3.1%. The 2nd revision was 2.8%, and the Q4 advance estimate was 3.2%. The strong upward revision to 3.1% is a result of a revision reduction in the negative GDP contribution changes in private inventories made and a upward revision in nonresidential investment. Here are the BEA GDP releases and website.
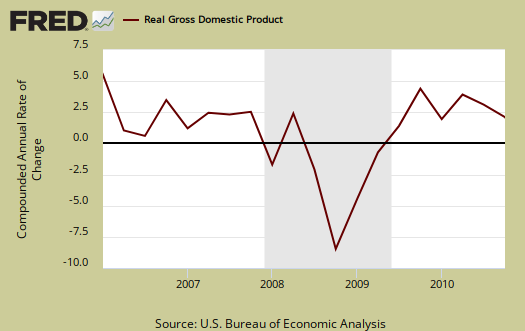
For the entire year, GDP increased 2.9% in 2010, revised upward 0.1%. This is in comparison to -2.6% annual GDP growth for 2009. Q4 GDP increased 2.8% in comparison to the 4th quarter of 2009. Below is annual real GDP, going back to the 90's. As you can see, we ain't roarin'.

One thing to note is energy and food inflation clearly increased, from the price indexes reported, in Q4 2010. Real GDP, which is 2.8% for Q4 2010, has had inflation removed. This is what real means in economic measurements.
The price index for gross domestic purchases, which measures prices paid by U.S. residents, increased 2.1 percent in the fourth quarter, the same increase as in the second estimate; this index increased 0.7 percent in the third quarter. Excluding food and energy prices, the price index for gross domestic purchases increased 1.1 percent in the fourth quarter, compared with an increase of 0.4 percent in the third.
As a reminder, GDP is made up of:
where
Y=GDP, C=Consumption, I=Investment, G=Government Spending, (X-M)=Net Exports, X=Exports, M=Imports*.
Here is the Q4 2010 3rd revision report breakdown of GDP by percentage point contributions:
- C = +2.79
- I = –2.61
- G = –0.34
- X = +1.06
- M = +2.21
Here is the Q4 2010 2nd revision breakdown of GDP percentage points:
- C = +2.88
- I = –3.13
- G = –0.31
- X = +1.18
- M = +2.17
Below are the percentage point differences, or spread between the third and the second revision Q4 2010 GDP report components. This represents the change of gross domestic product growth contributions from Q4 second to Q4 third revision.
- C = -0.09
- I = +0.52
- G = -0.03
- X = -0.12
- M = +0.04
Changes in private inventories was significantly revised from the 2nd revision report. Still a nose dive, –3.42, but a whopping +0.28 percentage point revision from the 2nd GDP report of -3.70 percentage points contribution to Q4 GDP.

Nonresidential fixed investment was also significantly revised, from a +0.51 percentage point contribution in the 2nd revision to a +0.73 percentage point contribution in the 3rd revision.
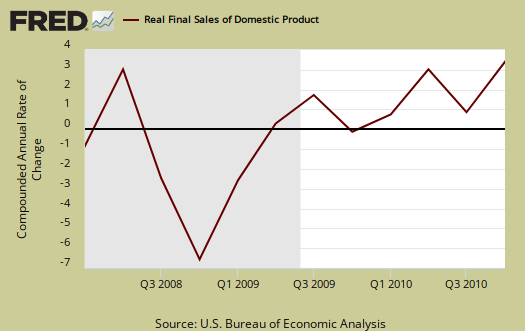
Below are real final sales of domestic product, or GDP - inventories change. This gives a better feel for real demand in the economy. Real final sales, which shows real demand, was unchanged, 6.7% from Q4 2010 second revision. Q3 real demand was at 0.9%, or on life support.
Below the the St. Louis FRED graph for C, or real personal consumption expenditures of the above GDP equation. As we can see from the above, while PCE, or C in the above equation, was revised down, it is still a fairly dramatic 41% percentage point increase in comparison to Q3's PCE contribution of 1.67 GDP percentage points. The actual PCE percentage change from Q3 was 4.0%, in comparison to 2.4% PCE change in Q3 2010.

Below is the breakdown in C or real PCE annualized change. Notice when times are tough, durable goods (bright red) consumption drops. Notice the increase in durable goods this quarter and Durable goods personal consumption was +1.45, revised from +1.44, percentage points of GDP in the 3rd GDP revision.

You might ask yourself how Imports could possibly add to GDP growth, when the United States runs a monthly trade deficit and imports subtract from GDP. It's due to the change, not the actual absolute deficit totals, which are absurdly high. When imports decelerate, that implies, per that quarter, more domestic goods and services were utilized to generate the changes in the rest of the GDP components. Therefore a deceleration in the trade deficit actually makes a positive contribution to GDP change. Keyword here is change, or growth, versus absolute totals. It's very similar to deceleration of private inventories negative affect on GDP.

The below graph is real imports vs. exports. While exports increased, it is the trade deficit that matters.

Below are the third revision percentage changes of Q4 2010 GDP components in comparison to the 3rd revision Q3 2010 GDP report:
- C = +4.0%
- I = –18.7%
- G = –1.7%
- X = +8.6%
- M = -12.6%
Below are the 2nd revision percentage changes of Q4 2010 GDP components. As one can see it was investiment, due to private inventory changes revisions, that added to increased GDP.
- C = +4.1%
- I = -22.1%
- G = -1.5%
- X = +9.6%
- M = -12.4%
Another point is note is how U.S. export growth was overstated initially.
Motor Vehicles was revised, subtracting -0.27, (versus -0.31 2nd revision) percentage points from Q4 real GDP while computer final sales added +0.35, revised up from +0.30, percentage point changes. This is different from personal consumption, or C auto & parts. Motor vehicles are bought as investment, as fleets by the government and so forth and in Q4, they plain didn't buy much, instead opted for computers.
Residential fixed investment added +0.07, revised upward +0.01 percentage points, to Q4 GDP after subtracting off -0.75 percentage points in Q3.. Below is the raw totals on residential investment. If one could ever see the housing bubble and then it's collapse in terms of economic contributions, the below graph is it. Residential fixed investment is only 2.6%, by percentage points, of this quarter's GDP growth.

Real Gross Domestic purchases, which is whatever people in the U.S. bought, regardless of country of origin, decreased -0.2%, revised upward from -0.6%, in comparison of a 4.2% increase in Q3 2010.
Here are the graphs from Q4 2010 GDP, advance report.
Here is the Q4 2010 GDP, 2nd revision report.
Recent comments