
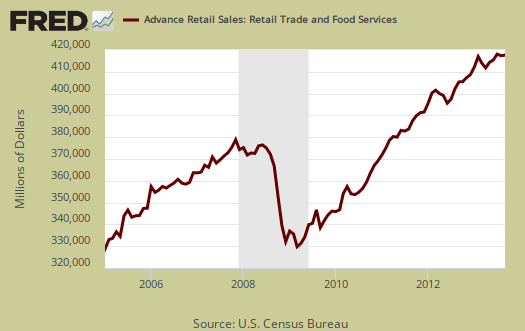
September 2013 Retail Sales decreased by -0.1% on auto sales, which plunged -2.4% from the previous month. Motor vehicle dealers sales have still increased 5.8% from a year ago. Without all motor vehicles & parts sales, September retail sales would have shown a 0.4% increase. Retail sales on the whole have only increased 3.2% from a year ago, although the quarter shows a 4.5% increase in comparison to Q3 of the previous year. Retail sales are reported by dollars, not by volume with price changes removed.
Retail trade sales are retail sales minus food and beverage services. Retail trade sales includes gas, and is down -0.2% for the month and has increased 3.1% from last year. People are shoppin' less it seems.
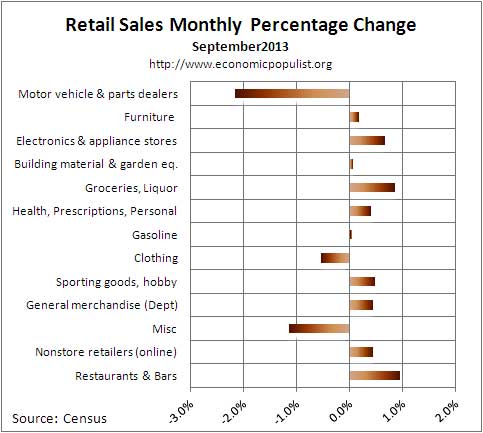
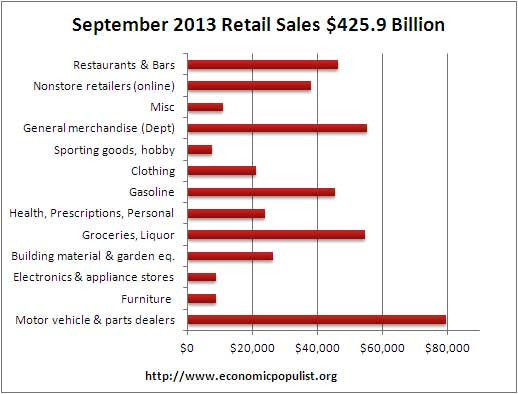
Total retail sales are $425.9 billion for August. Below are the retail sales categories monthly percentage changes. These numbers are seasonally adjusted. General Merchandise includes super centers, Costco and so on. Online shopping making increasing gains, increasingly important in overall retail sales. Online shopping continues to expand as nonstore retail sales have increased 8.9% from last year.
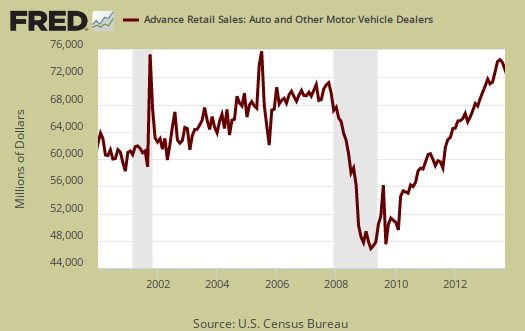
Below is a graph of just auto sales. We see how the recession just decimated auto sales and also how autos have had a pretty good run since that time. Notice the recent downturn in auto sales. While auto manufacturers have warned the government shutdown would slow sales, it is unclear why sales declined. Some are quoted as claiming a supply shortage while others are blaming less shopping days in September, which hardly seems to be reality considering labor day was on the 2nd.
Gasoline station sales have declined -3.8% from one year ago. The ones that are hurting are Departments stores. Their retail sales are down -6.0% from August 2012 with general merchandise stores, where department stores are a subcategory, have increased 0.6% from a year ago. Obviously people are shopping at department stores less and less. Building materials, garden sales, which are large by volume, have increased 5.8% from a year ago. Grocery stores have increased sales by 3.4% from this time last year.  Sporting goods, hobbies, books & music sales have increased 2.8% from last year.   ;Miscellaneous retail stores have increased 6.2% from a year ago and Furniture is up 4.3%.
Below are the retail sales categories by dollar amounts. As we can see, autos rule when it comes to retail sales.   We also see that electronics, which are up 1.8% from a year ago, is much smaller by total dollars than motor vehicle sales. This implies there is a hell of a lot of hype around smart phone sales in terms of the overall economy. The cell phone industry knows how to use the press instead of pay for advertising to hype their products, but in terms of the U.S. economy, cell phones are a drop in the bucket.
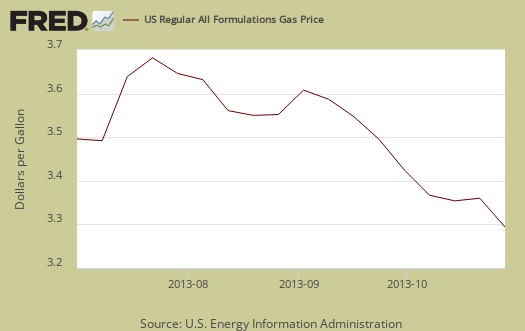
Graphed below are weekly regular gasoline prices, so one can see what happened to gas prices in September. Gas was declining in September, so price explains the declining sales for gasoline stations. The below graph goes into October, so we can expect no growth gasoline station sales in next month's retail sales report.
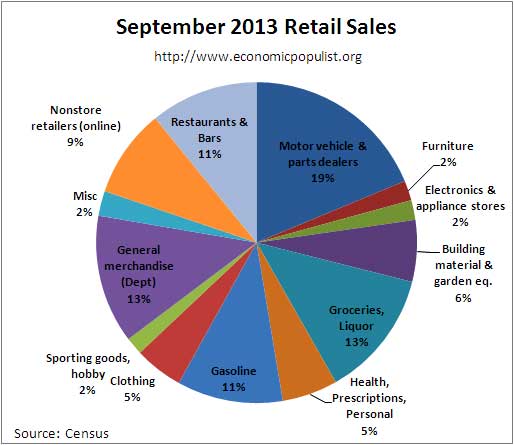
The below pie chart breaks down the monthly seasonally adjusted retail sales by category as a percentage of total August sales by dollar amounts. One can see how dependent monthly retail sales are on auto sales by this pie chart. We also see non-traditional retailers making strong grounds on traditional general merchandise stores.
Retail sales correlates to personal consumption, which in turn is about 70% of GDP growth. Yet GDP has inflation removed from it's numbers. This is why Wall Street jumps on these retail sales figures. Below is the graph of retail sales in real dollars, or adjusted for inflation, so one gets a sense of volume versus price increases. Below is the annualized monthly percentage change in real retail sales, monthly, up to August 2013. While some in the press are claiming retail sales implies poor consumer spending, it looks like sluggish consumer spending for Q3, although to really estimate PCE we need the actual monthly statistics.
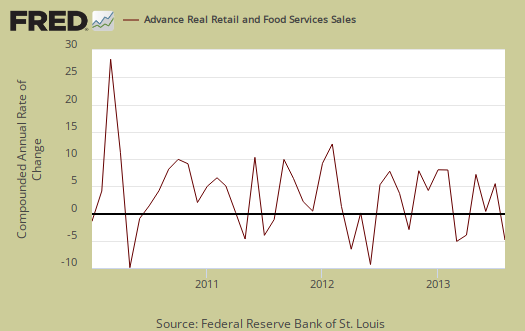
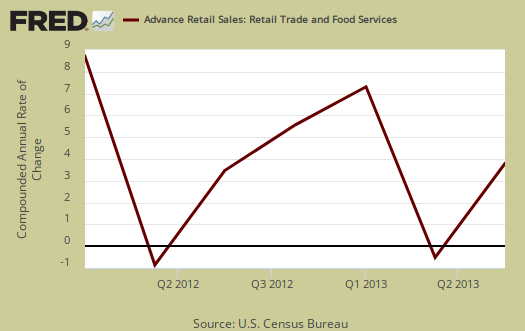
To obtain real values, retail sales are deflated using CPI. Below are the real retail sales quarterly annualized percent change. The graph displays up to Q2 2013. Due to the shutdown, CPI won't be out until tomorrow.

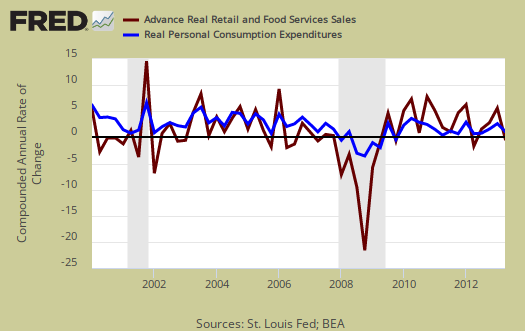
Below is a graph of real PCE against real retail sales, quarterly, up to Q2. See how closely the two track each other? PCE almost looks like a low pass filter, an averaging, removal of "spikes", of real retail sales. Here are our overviews for PCE. Here are our overviews of GDP.
Retail sales are not adjusted for price increases, not reported in real dollars. Real economic growth adjusts for inflation. Retail sales has variance, margins of error, and is often revised as more raw data comes into the U.S. Department of Commerce (Census division). For example, this report has an error margin of ±0.5%. Data is reported via surveys, and is net revenues of retail stores, outlets. Online retail net revenues are asked in a separate survey of large retail companies (big box marts). This is also the advanced report. To keep the monthly nominal percentage changes in perspective, below is the graph of monthly percentage changes of retail sales since 2008.
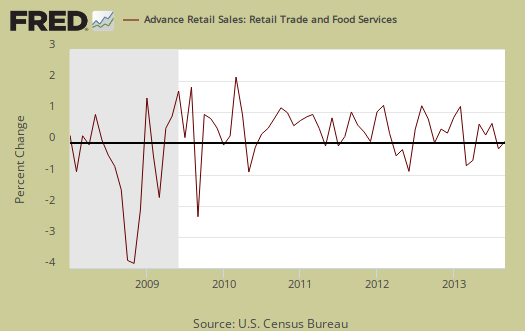
For the three month moving average, from July to September, in comparison to April to June, retail sales have increased 1.1%. The retail sales three month moving average in comparison to a year ago is up 4.5%. This implies just slightly better spending overall as shown the below graph of quarterly annualized retail sales percentage change, up to Q3 2013. We do not know inflation or prices yet, but by raw volume, it looks like consumer spending will be around the same as Q1. In a word, sluggish.
Seasonal adjustments are aggregate and based on events like holidays associated with shopping, i.e. the Christmas rush. Advance reports almost always are revised the next month as more raw sales data is collected by the Census. In other words, do not get married to these figures, they will surely be revised. Here is our retail sales topic category.
Here are past retail sales overviews, unrevised.
Recent comments