
The press and pundits shout the unemployment rate dropped to 8.2%, the lowest since January 2009, over three years ago. Yet March only added 120,000 jobs and those reported as employed dropped by -31,000. So, how could the official unemployment rate drop when the jobs added barely keeps up with population growth and the increase in those employed actually dropped?
First, the unemployment rate is a ratio and based on a host of definitions on who is counted as unemployed and who is not. See what's the real unemployment rate and under the hood for more details.
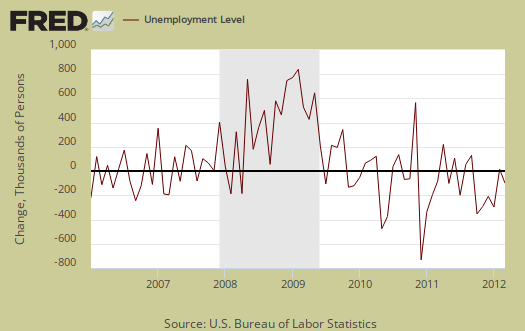
This month the civilian non-institutional population increased +169,000 to 242,604,000. The civilian non-institutional population are those 16 years or older not locked up somewhere or not in the military or so sick and disabled they are in a nursing home and so on. Below is a graph of the monthly change in non-institutional population.

You see those yearly spikes and drops? Those are not magic sudden changes in population, those are statistical yearly adjustments. That mondo spike in January is the 2010 Census adjustments. In other words, the BLS adjusts the error for the entire year and tacks it onto the change between December and January. Additionally, every 10 years the new Census adjustments are added. All other ratios, including the unemployment rate, are derived from the non-institutional civilian population base. The workforce comes from this group of the population as does the group considered not in the labor force.
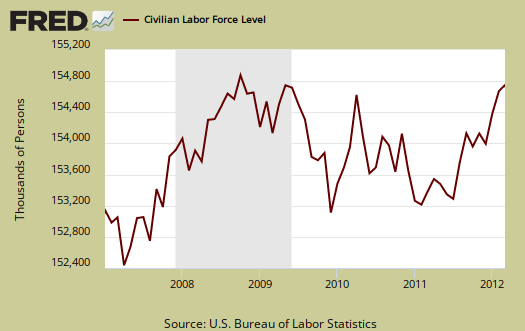
The subgroup of non-institutional civilian population considered in official unemployment rates is called the civilian labor force. This is where the official employed and unemployed come from. This month the civilian labor force decreased -164,000 to 154,707,000.
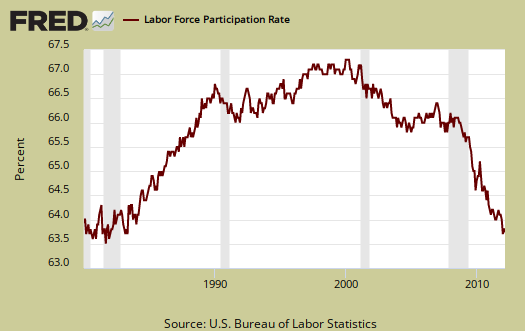
The ratio of those participating in the workforce is 63.8% to those who are not. In other words only 63.8% of the non-institutional civilian population is counted as the civilian labor force. This ratio is called the labor participation rate. Only 63.8% are considered participating in either working or officially looking for work, the rest of the civilian non-institutional population, 36.2%, are not counted and are called not in the labor force. This ratio is at all time lows and ticked down a 10th of a percentage point from last month.
The unemployment rate is calculated by:
There are two places the unemployed can go. They can find a job or drop out of the count and enter not in the labor force.
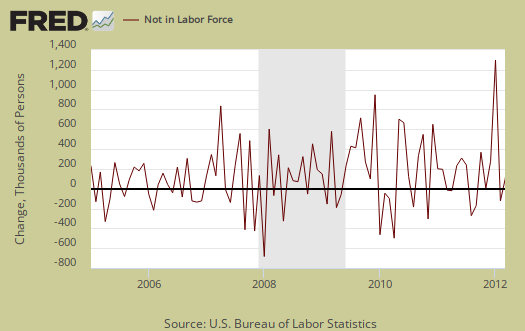
The monthly change for those not in the labor force who are part of the non-institutional civilian population increased by 333,000. The monthly change of those not in the labor force is a statistically noisy figure, as shown in the below graph.
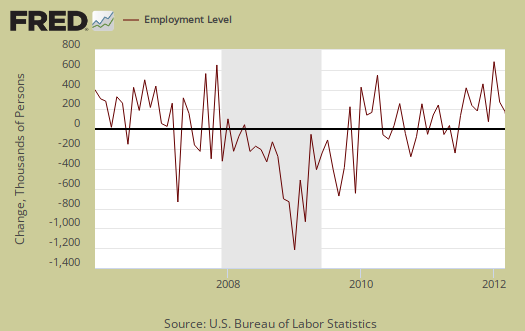
Those of the civilian labor force who are employed decreased -31,000 to 142,034,000. Below is the monthly change in employment levels for the population based unemployment survey.
Those unemployed decreased -133,000 to 12,673,000. Where did those people go to when those employed decreased? They went to not in the labor force, no longer counted as unemployed. There are millions of these people who have given up looking for work, then start looking again, when it looks like there might be a shot at a job out there.
There are actually two separate employment surveys. Those 120,000 payroll jobs added are from the other survey, the payrolls or CES survey. This separate survey asks businesses, not people, how many actual jobs they added. The household survey, from where the unemployment rate comes, has a smaller sample size, a larger error margin, plus those yearly adjustments.
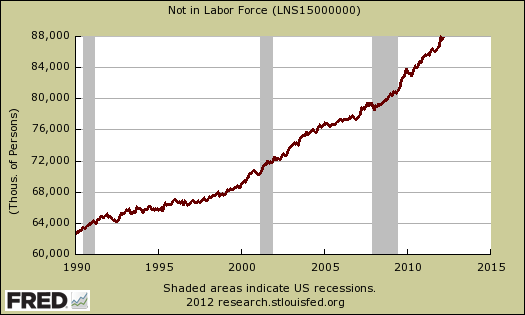
The unemployment rate is just a ratio. Realize there is a large segment of the underground working population that is classified as not in the labor force as well as millions who actually want and need a job. The below graph represents those people considered not in the labor force and is at record highs. That said, U.S. population continues to grow so part of the not in the labor force upward trend is a natural result of increased population growth.
Bottom line, we're still in a jobs crisis, no matter if the unemployment rate drops a couple of points. An unemployment rate of 8.2% is a long, long way off from the November 2007 rate of 4.7%.
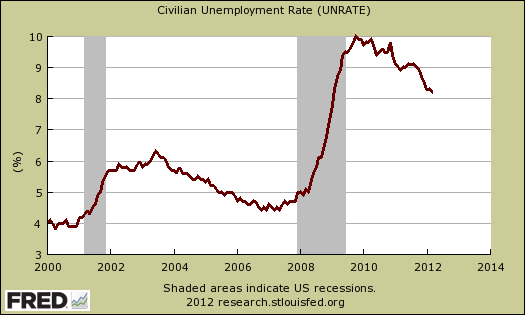
In other words, the official unemployment rate is close to double what it should be for a healthy job market. People are so used to a crappy, unbelievably worker hostile, labor market, they don't realize we have not had a decent job market since 2000. That's 12 years ago! The unemployment rate in April of 2000 was 3.8%. That's where we should be, not singing cheers over 8.2%, especially when this month's report indicates more people dropped out from the count.
Recent comments