
The December 2010 monthly unemployment figures are out. The official unemployment rate decreased to 9.4% and the total jobs gained were 103,000, with 15,900 of those jobs being temporary. Total private jobs came in at +113,000, in stark contrast to the 297,000 ADP reported for December. How the unemployment rate could drop when there were not enough jobs added to even handle U.S. population growth is explained below.

Those added to not in the labor force was +434,000. The labor force participation rate dropped -0.2% from last month to 64.3%. This is the lowest labor participation rate since April 1984. U6, or the broader unemployment measurement, dropped -0.3% to 16.7%, but also due to not counting people.
Below is the nonfarm payroll, the total number of jobs, seasonally adjusted. Since the start of the great recession, declared by the NBER to be December 2007, the United States has officially lost 7.239 million jobs.
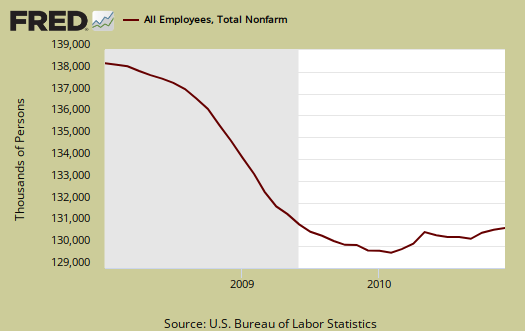
Below is a running tally of how many official jobs permanently lost since the official start of this past recession (recall the private NBER has declared the recession over!). This is a horrific tally and notice this isn't taking into account increased population growth, which implies the United States needs to create at least 10.5 million jobs to break even from December 2007.

How can the unemployment rate decrease so dramatically when not enough jobs were added to even cover population growth? Because the people the BLS counts dramatically decreased, they didn't disappear, but are re-categorized as not in the labor force.
The civilian labor force decreased by -260,000. Of those still in the civilian labor force, employed, increased by 297,000 in December, yet those unemployed dramatically dropped by over half a million, or -556,000. Those not in the labor force increased by +434,000 in a month. What we see here are people simply dropping out of the count (434,000) and less people entered the labor force...looking for work, officially.
The civilian non-institutional population are those 16 years or older not locked up somewhere or not in the military or so sick and disabled they are in a nursing home and so on.
The civilian non-institutional population rose by 174,000 last month. The civilian population now stands at 238,889,000. Not in the labor force are those of the civilian non-institutional population who are not counted as looking for work or having a job. Yet those not in the labor force stands as a horrifying 85,199,000, or 37% of the non-institutional civilian population. An equally horrific 14,485,000 people of the official tally are out looking for work.
The amount of people who were fired or lost temporary jobs in December dropped by -548,000 to 8,923,000. This is the total, which again reflects people are dropping off of the count. Job leavers increased by 50,000, re-entrants, or those trying again (officially), decreased by -19,000 for December while new entrants increased by 42,000.

The increasingly low labor participation rate is now at 63.4%. If we go back to December 2007, the labor participation rate was 66%. The highest civilian labor participation rate was in January 2000, at 67.3%. What this means is there are almost 4.1 million people not be accounted for in the official unemployment rate who probably need a job and can't find one.

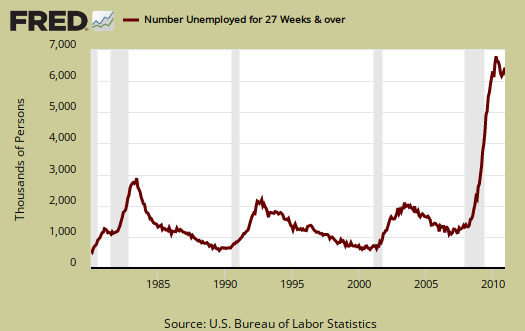
The long term unemployed (> 27 weeks) increased by +113,000. in December. 44.3% of the official unemployed have been so for 27 weeks or longer.
- Long term unemployed - 6.441 million
- Forced Part Time - 8.931 million
- Marginally attached to the labor force - 2.609 million
Of the Marginally attached, 1.318 million are discouraged. While forced part-time dropped -29,000 this month, the marginally attached, or those not counted but really wanting a job, increased 389,000, or 42% over the past year.
U6, defined as total unemployed, plus all persons marginally attached to the labor force, plus total employed part time for economic reasons, as a percent of the civilian labor force plus all persons marginally attached to the labor force, (table A.15), was 16.7%. While this number is obscene, it is also misleading that U6 really dropped. The reason again if the base metric, or civilian labor force is simply not counting a good 4 million people.
The employment to population ratio is now 58.3% also at record level lows. This isn't a structural change, such as all families decided to have a stay at home caretaker, or magically a host of people could retire early, this is people dropping out of the count.
These numbers are important because unemployment is a ratio, percentage or during a limited time period, the number of people actively looking for a job and counted. Many people are not counted in the official unemployment statistics, due to definitions, but obviously when one has more potential workers and less jobs, that metric doesn't bode well for America.

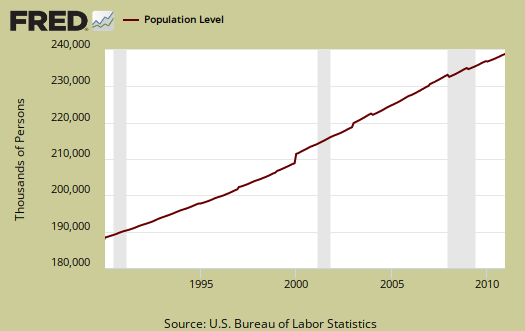
Below is the graph of the civilian non-institutional population, which is the largest super-set of the potential labor force, larger than the civilian workforce, due to those who are not looking for work, retired and so on being counted in this figure. It increased this month by 174,000 to 238,889,00. Compare that to the civilian labor force, now at 153,690,000, a decrease of -260,000. That ain't all baby boomers retiring, again people are simply not being counted. Except for some statistical adjustments, the monthly rate of change in civilian non-institutional population is a reasonably constant 1% population growth. This is why one must create jobs greater than the constant rate of jobs lost. There are more people to employ. Unemployment is a percentage, a ratio.
The BLS unemployment report counts foreign temporary guest workers as well as illegal immigrants in their U.S. labor force statistics.
In looking over table B1 we can get a little more detail on what kind of jobs were created (and lost) on the permanent jobs front.
- Financial: +4,000
- Information: -4,000
- Construction: -16,000
- Manufacturing: +10,000
- Mining & Logging: +4,000
- Health and Education: +44,000
- Leisure and Hospitality: +47,000
- Food & Drink: +25,00
- Professional & Business Services: +7,000
- Temporary: +15,900
- Accounting: -10,700
- Trade, Transportation, Utilities: +31,000
- Retail Trade: +12,100
- Government: -10,000
Local government lost -20,000 jobs, odds on a reflection of their budget shortfalls. Temporary help services has increased 495,000 from a year ago, which implies job creation is more disposable worker mentality from employers. Contained within construction are civil engineers, a very difficult skill set requiring experience & education. Employment dropped -13,000 among civil engineers & heavy engineers in a month.
Bear in mind illegal workers and foreign guest workers are counted as employed Americans, which can distort occupational sectors, particularly the Science and Technology ones. Below are the unemployment rates per occupational sector from table A-14, not seasonally adjusted. Look at how high information, professional and business services is. Tell me offshore outsourcing is not having an effect again. The BLS claims jobs have been created in these areas, yet look at the unemployment rate. Something is wrong with this picture. Could it be foreign guest workers included in the job count?
- Financial: 6.4%
- Information: 8.1%
- Construction: 20.7%
- Manufacturing: 10.0%
- Transportation, Utilities: 7.4%
- Information: 8.1%
- Mining & Gas, Oil: 10.8%
- Health and Education: 5.2%
- Leisure and Hospitality: 12.0%
- Professional & Business Services: 10.2%
- Retail, Wholesale Trade: 7.2%
- "Other" Services: 18.1%
- Government: 4.4%
- Agricultural: 18.1%
- Self-employed, unpaid family: 6.5%
The above implies if you're preying in the sick and elderly through high medical costs, you've got a job and if you're working for the Federal Government, you've got a job. These numbers imply we do not have a production economy. Probably the most horrific number is the Professional and Business Services unemployment rate, for that occupation category implies a college degree.
One needs at least 175,000 and some estimate up to 325,000 permanent full time jobs, added each month just to keep pace with U.S. civilian workforce population growth. That's not general population, that's the group needing a job. To even get back to pre-recession unemployment rate levels we need a good 424,000 jobs created each month. That's permanent jobs. Even if the U.S. created 400,000 permanent jobs each month, it would take over 18 months to recover the jobs lost since January 2008, or the start of the great recession. If one created 400,000 jobs per month, to get to the start of the great recession unemployment rate of 5%, or roughly 10.5 million jobs, it would take over 26 months, or over 2 years to recover. Below is the seasonally adjusted monthly change in the number of payroll jobs in the U.S. See a lot of over 400,000 monthly increases in the past decade?

You probably also want to know the birth/death model. What is that? It's a statistical adjustment to compensate for new businesses and dead businesses who are not actually tallied by data reports. Those jobs created and died outside the statistical reporting time window due to lag. So, the BLS estimates how many jobs can be attributed to those firms which are not actually counted. This month's adjustment was +24,000 jobs. Now one cannot directly subtract the birth/deal model monthly numbers, because unemployment data is seasonally adjusted, yet the birth/death adjustment is not seasonally adjusted, get that? Anywho, jobs attributed to new and dead businesses are just an estimate in so many words.
The average work week remained the same, 34.3 hours. Average earnings for the private sector (drum roll please), increased 3¢ to $22.78/hr. Take a look at how many industry sections are below full time hours. When the number of hours per worker is below full time, beyond the labor implications, there also is a common practice among employers to keep workers part-time, in order to deny them benefits.

Here is last month's report, unrevised. The below revisions are improvements of the last two months previous payrolls, with November almost doubled.
The change in total nonfarm payroll employment for October was revised from +172,000 to +210,000, and the change for November was revised from +39,000 to +71,000.
Subject Meta:
Forum Categories:
| Attachment | Size |
|---|---|
| 236.6 KB |
This report is TERRIBLE!
What is shows is a huge increase in people falling into the homeless, the permanent poor, the jobless who are not counted. It's also creating a flurry of articles on how arcane the BLS methods are and I have to agree. Of all of the overviews and analysis of various economic reports, this one takes me the longest because I must run a host of calculations to find the hidden jobless.
ADP vs BLS
Why the huge discrepancy between ADP and the BLS numbers? 297,000 to 103,000 when government only shed 10,000 jobs. Temp workers for the holidays? I wonder how many jobs U.S. companies are creating overseas? I'd like to see those numbers. At some point our congress and president need to reward companies for creating jobs in the U.S. or at least paying taxes in the U.S.
I am very disappointed in these numbers. I truly thought it was going to be a 200,000 plus blowout after the ADP report. Damn.
good question, "sampling error" ;)
here is the sample size of the two surveys for the BLS:
But the numbers I really focused on are from the establishment survey, which "should" be the most accurate.
ADP has a sample size of 340,000 businesses, but I guess is also relying on them being "honest" maybe. These are all private.
There have been other times the ADP diverged from the BLS in slope and it seems to be when the monthly changes are greater. I think the correlation was at 0.94 or so.
I've got to write up more graphs and calculations on this. I fully expected to finally get some jobs and it's like we have something really awful going on here where America and Americans, in terms of the "two economies" has decoupled almost completely at this point.
ADP on the other hand is
Thanks and found the other stat...
that I was curious about from one of your comments:
"I've got a running tally on jobs offshore outsourced since 2008 and right now I've got 2.7 million."
seasonal adjustments
Another factor is seasonal adjustments and the assumptions, algorithms for. I forget when the yearly adjustment is, but it's been over 1 million recently and I keep meaning to dig around on this because that might also be a reason the ADP and the BLS diverge so much.
On the offshore outsourcing tally, yeah, that's from some studies done, where the numbers are estimated and I've just added them together. Problem is, frankly one of them is from a NBER paper, which has some seriously bogus, as in "I can't believe they allow this crap to be published" bogus paper trying to deny offshore outsourcing is affecting the U.S. workforce. Uh, duh, you don't need a 2nd grade education to see what has happened in town after town, particularly the midwest.
But I'll try to gather all of that and I have to do some raw data analysis because the NBER paper is so full of shit. If you're interested, you can pull some of this from the new Census data, but to really get it is near impossible. It's in various press releases and many corporations hide those numbers so close to the chest, you just can't get them. Also a job these days doesn't need to be directly offshore outsourced, more simply created in India or China instead of the U.S.
EPI missing workers 4.4 million
I think they might be more on the money than I because the are projecting just the working age population, but they don't publish their assumptions. My estimates are much more rough because within non-institutional population are retired, people going back to school/going to school, homemakers and so on and when break up the different age brackets, say 18-24 vs. 26-55 and so on, it's not a linearly relationship on who really is wanting needing a job, working versus doing other things. Suffice it to say there is around 4 million (consensus) missing workers, not already accounted for in the BLS report, who need a job and can't get one.