
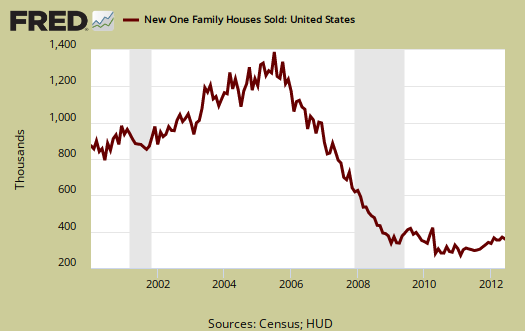
June New Residential Single Family Home Sales declined by -8.4%, or 350,000 annualized sales. This monthly percentage change has a ±12.4% error margin. May's single family new home sales were significantly revised down, from +7.6% to +6.7%, or 382,000 annualized sales. April was revised up to 358,000 from 343,000 as was March, to 352,000.
New single family home sales are now 15.1% above June 2011 levels, but this figure has a ±16.7% margin of error. A year ago new home sales were 304,000. Sales figures are annualized and represent what the yearly volume would be if just that month's rate were applied to the entire year. These figures are seasonally adjusted.
The Census claims June new home sales dropped -60.0% in the Northeast from May. While this seems absurd on it's face, the Northeast region was a mega hot baking oven in June. Northeast reported sales have a ±18.9% error margin.
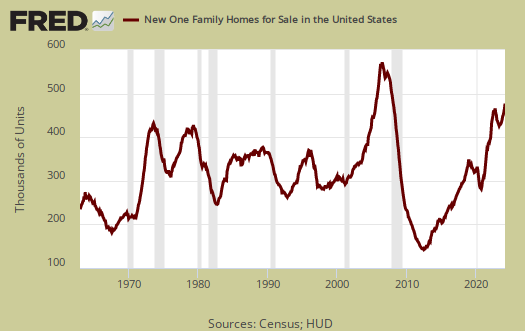
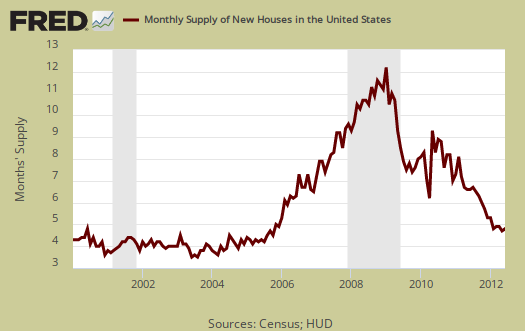
The current supply of new homes on the market would now take 4.9 months to sell, an increase of 8.9% from last month. The amount of new homes for sale was 144,000 units, annualized and seasonally adjusted. From a year ago housing inventory has declined -25.8%. These is a record low in the supply of new homes for sale, as shown in the below graph.
Below is a graph of the months it would take to sell the new homes on the market at each month's sales rate. We can see these inventories vs. sales times have dropped dramatically from a year ago.
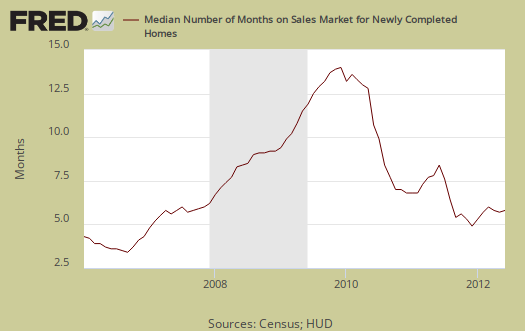
The median time a house was on the market before it sold was 8.0 months, a 10th of a percentage point increase from last month.
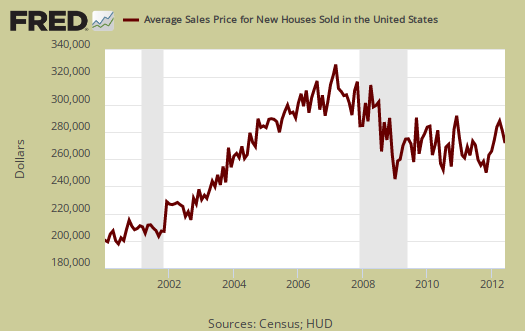
June's average home sale price was $273,900 and dropped -1.5% from last month. May's average new home price was $278,000. Both June and May saw at least 1,000 homes selling above $750,000, which affects the monthly median and average sales prices.
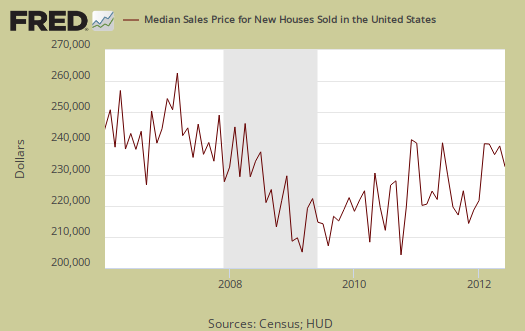
June's median price was $232,600, whereas May's median price was $237,100, a -1.9% monthly decline. Median means half of new homes were sold below this price and both the average and median sales price for single family homes is not seasonally adjusted.
The variance in monthly housing sales statistics is so large, in part, due to the actual volume declining. One needs to look at least a quarter to get a real feel for new home sales, but a year of sales data is more in order. Additionally this report, due to it's huge margin of error, is almost always revised significantly the next month. Buyer beware on month to month comparisons.
What we can say about new homes sales is a bottom does seem to have been hit and we have stabilization. We caution about going hysterical on monthly numbers for new home sales are often significantly revised and sales volume after the housing bubble burst is low. We list the margins of error for they are usually above the monthly reported percentage changes.
Zillow yesterday declared the bottom has been reached on home prices and will increase. This is for all homes, whereas this report is just for newly constructed ones.
Home values in the United States have reached a bottom. The Zillow Home Value Index (ZHVI) rose on an annual basis for the first time since 2007, increasing 0.2 percent year-over-year to $149,300, according to Zillow's second quarter Real Estate Market Reports. Values have risen for four consecutive months.
Nearly one-third of metros, or 53 of the 167 covered by the Real Estate Market Reports, posted annual increases in home values. The largest increase came in Phoenix, where home values are up 12.1 percent from the second quarter of 2011 to the second quarter of 2012.
Looking ahead, two in five, or 67 of the 156 markets covered by the Zillow Home Value Forecast, are expected to see increases in home values over the next year, with the largest increases expected in the Phoenix metro (9.9 percent) and the Miami metro (6.1 percent). U.S. home values are expected to rise 1.1 percent.
Calculated Risk is a fantastic analysis site on housing data, with comparisons in new home sales to recessionary periods going back back to 1963.
Here is last month's new home sales overview, only graphs revised.
New Homes Sales and Why We Like Graphs
There is an incredible raging opinion storm out there on new home sales. That's why we like graphs! What does it mean to see the "largest percentage increase since 2010 for May or, the largest decrease in one year" at all? It does not matter and the reason it does not matter is the margin of error and the revisions for this report.
This is also why we use so many graphs. You can see the levels of sales, by annualized volume here and that's where it's at! What we see are levels along 2009 and very early 2010 and that's it! New Home sales have not returned, nor will they, to 2006 levels and going off of anything else but levels and also realizing this report is strongly revised, for at least 3 months after the initial data is key to following along.
From the press and financial frenzy, the other thing we know is those inane bubble bugs from 2006 are lurking around in the shadows, just waiting to multiply again. We're sorry residential real estate idiots, that bubble is long gone, just like the tech bubble of 2000. You're gonna have to find a brand new thing to hype the hell out of before people catch on much to late in the game.
Come on people, do you really believe new home sales dropped 60% in a month in the Northeast region of the country? Jesus, get real, this report will be revised!