
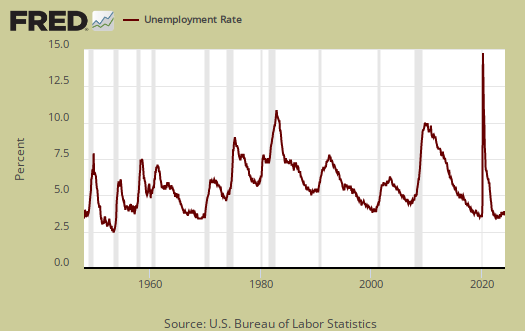
The December unemployment rate dropped on almost half a million more people considered not part of the labor force. The official unemployment rate is now 5.6%, a -0.2 drop from last month. The labor participation rate went back to 38 year record lows and is 62.7%. From a year ago, the number of people considered not in the labor force has increased by 1.2 million those considered employed grew by 2.7 million. Most in the press will proclaim this is a great employment report, yet the over quarter of a million monthly drop in the labor force size is most disconcerting.
This article overviews and graphs the statistics from the Employment report Household Survey also known as CPS, or current population survey. The CPS survey tells us about people employed, not employed, looking for work and not counted at all. The household survey has large swings on a monthly basis as well as a large margin of sampling error. The CPS has severe limitations, yet, it is our only real insight into what the overall population are doing for work.
The ranks of the employed grew by 111,000 this month. This is within the margin of error of the survey. From a year ago, the employed has increased by 2.751 million. This isn't really a large increase in annual employed if one takes increased population growth into consideration but is increasing beyond what is needed to keep up.

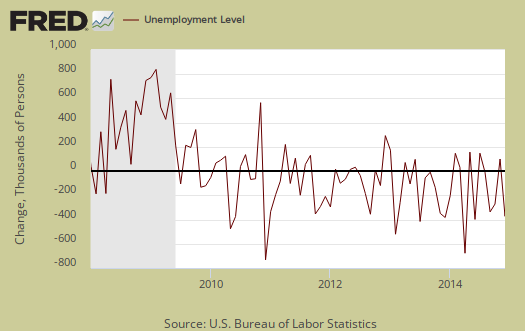
Those unemployed decreased -383,000 to stand at 8,688,000. From a year ago the unemployed has decreased by -1.688 million. Below is the month change in unemployed and as we can see, this number normally swings wildly on a month to month basis.
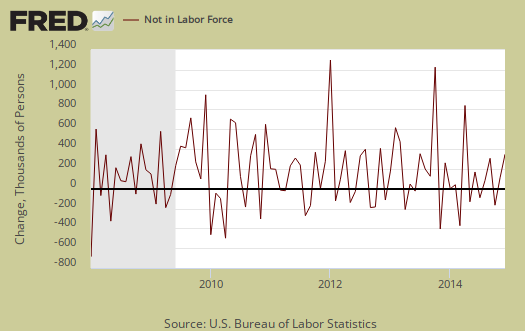
Those not in the labor force increased by 456,000 persons and to bet 92,898,000. The below graph is the monthly change of the not in the labor force ranks. Notice the increasing swells and wild monthly swings. Those not in the labor force has increased by 1,200,000 in the past year.
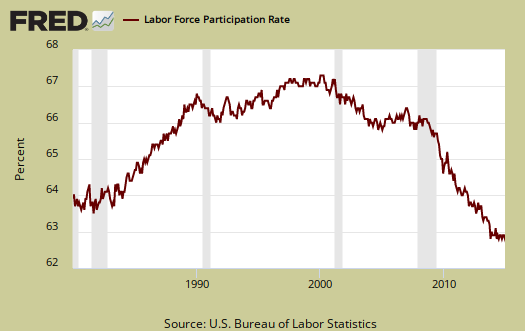
The labor participation rate is at 62.7%, a -0.2 change from last month. Those aged 16 and over either working or looking for work is still at record lows, as shown in the below graph.
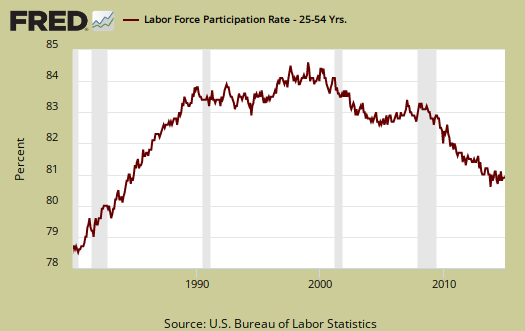
The low labor participation rate is not all baby boomers and people entering into retirement. Below is a graph of the labor participation rate for those between the ages of 25 to 54. These are the prime working years, so one cannot blame retirement and college on the declining participation rate. The 25 to 54 age bracket labor participation rates have not been this low since the 1980's recession and the rate stands at a three month static 80.8%.
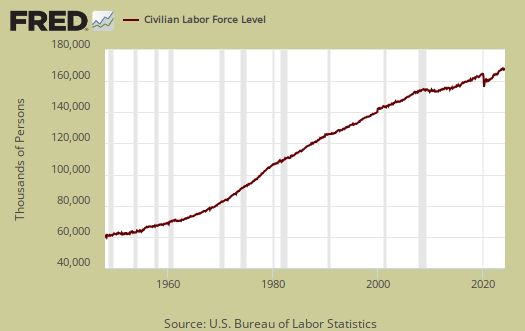
The civilian labor force, which consists of the employed and the officially unemployed, decreased by a whopping -273 thousand this month. The civilian labor force has grown by 1,082,000 over the past year. New workers enter the labor force every day from increased population inside the United States.
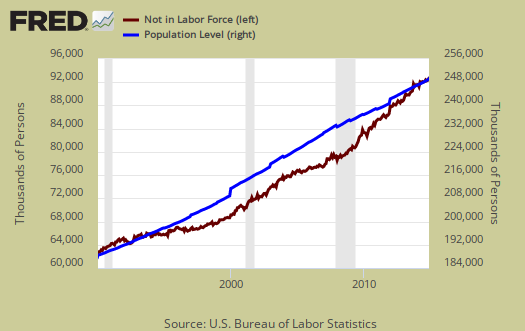
In spite of wild statistical swings, those not in the labor force often grows faster than the population which has the potential to work. Below is a graph of those not in the labor force, (maroon, scale on the left), against the noninstitutional civilian population (blue, scale on the right). Notice how those not in the labor force crosses the noninstitutional civilian population in growth and the accelerated growth started happening right in 2008. There were not enough babies born starting in 1943 to explain the steep 2008 increase in those not in the labor force.
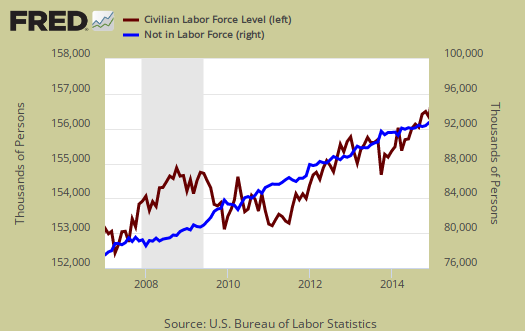
Below is a graph of the civilian labor force, or the official employed plus unemployed, in maroon, scale on left, against those not in the labor force, in blue, scale on right. Notice how those not in the labor force as a trend exceeded those considered employed and unemployed starting around mid 2009. What we have seen is a never ending growing segment of the population that is considered neither employed or unemployed, i.e. not in the labor force, increasing, above the trend line of those who would be naturally dropping out, such as the retired and those in school. Not in the labor force figures do include retirees and the size of the population greater than age 65 has grown.
Those considered employed as a ratio to the total Civilian noninstitutional population now stands at 59.2%, which is more no change for three months. For the interested, there is a relationship between the employment-population ratio and the labor participation rate (LPR): employment-population ratio = LPR * (1 - unemployment rate).

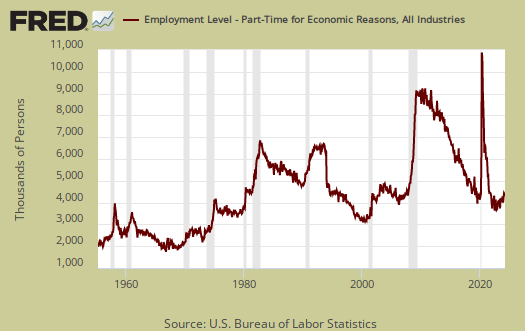
There are millions of people who need full-time jobs with benefits who can't get decent career oriented positions. Those forced into part time work is now 6,790,000, an decrease of -61,000 from last month. Those stuck in part-time hours has declined by 976 thousand over the past year. The below graph shows levels of people who could only get part time hours have remained elevated since the recession but the recent decline is a positive showing.
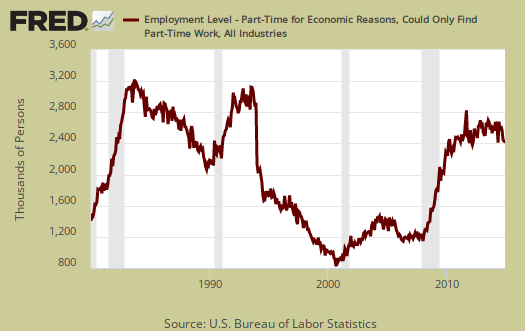
There are two categories of those working part-time hours. Those who could only get part-time jobs and those working who got their hours cut due to businesses not having enough work for them. The number of people who could only get part-time work declined slightly by -15 thousand to 2,432,000 as shown in the below graph.
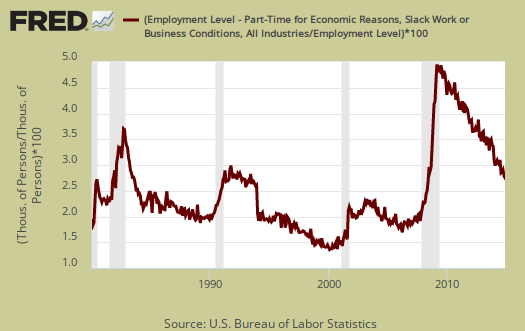
People can also be stuck with part-time hours due to slack working conditions,which barely declined -7,000 and stands at 4,061,000. From a year ago those who are getting their hours slashed due to weak economic demand has declined by -16.8%. Below is a graph of forced into part-time work because they got their hours cut, as a percentage of the total employed. This is a recession economic indicator, notice the line slope matches strongly the graph gray recession bars.
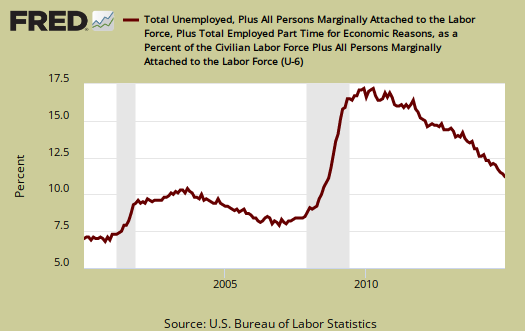
U-6 is a broader measure of unemployment and includes the official unemployed, people working part-time hours because that's all they can get and a subgroup not counted in the labor force but are available for work and looked in the last 12 months . The U-6 alternative unemployment rate still leaves out some people wanting a job who are not considered part of the labor force. U-6 dropped two tenths of a percentage point and stands at 11.2%.
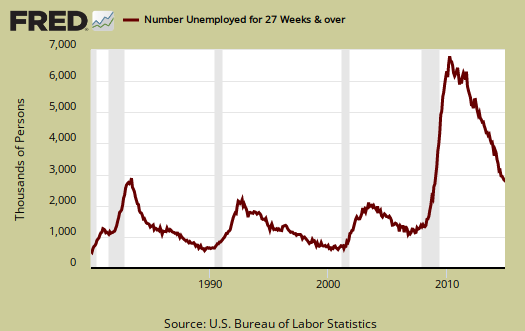
The long term unemployed, or those unemployed for 27 weeks and over, dropped by -37,000 to stand at 2,785,000 people. From a year ago the long term unemployed ranks have decreased by -28.2%, but this does not mean at all those folk found work. Some must be dropping out of the labor force, giving up.
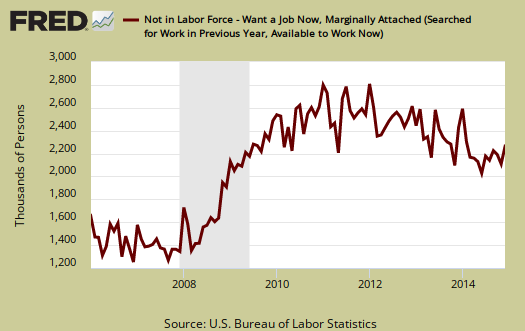
The marginally attached are people not in the labor force because they have not looked for a job in the last month, but have looked for a job in the last year. This number has ballooned since 2007 and not returned to pre-recession levels. It's like a perpetually static figure at this point. The graph below is the number of people considered marginally attached to the labor force, currently at 2.260 million. The marginally attached should only be viewed as a long term trend for the figures are also not seasonally adjusted.
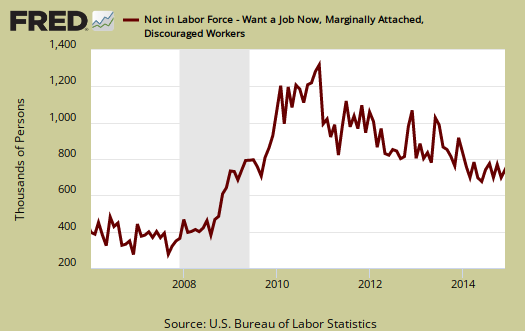
The discouraged worker statistics are about people, not counted as part of the civilian labor force, who not only want a job, but also looked for one in the last year. & nbsp;These people aren't job hunting now because they believe there are no jobs out there. These figures also have no change. Below is the graph of discouraged workers, currently at 740 thousand people and are a subset of the marginally attached.
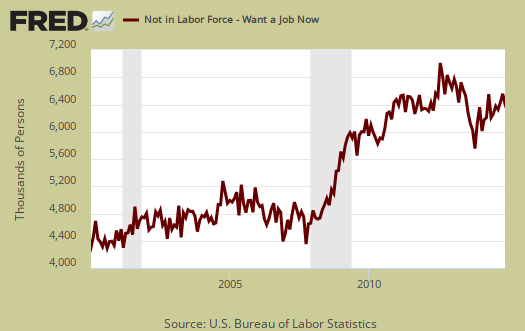
Our favorite statistic from the CPS survey is how many people who are considered not in the labor force, report they want a job now. It is a direct survey question from the CPS. The survey asks people who are not being counted in the unemployment statistics and official unemployment rate if they want a job. The number who answer yes currently stands at 6,445,000, a very large number of people. Those who are not counted yet report they want a job includes the discouraged workers and marginally attached and is seasonally adjusted. This figure has increased by 4.8% from a year ago. This figure should drop along with the unemployment rate as these people rejoin the job hunt if the labor situation was really great, so something is very wrong for workers and job seekers with this kind of annual gain.
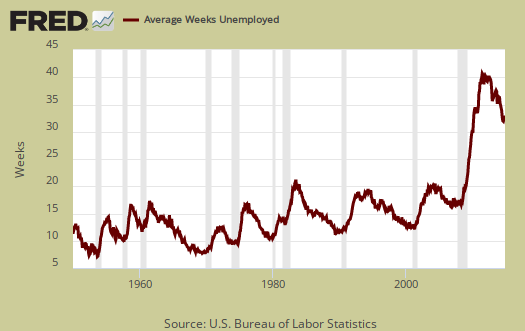
The average length of unemployment is 32.8 weeks and a year ago was 36.8 weeks. Even with a month drop that's still a very long time to be without a paycheck.
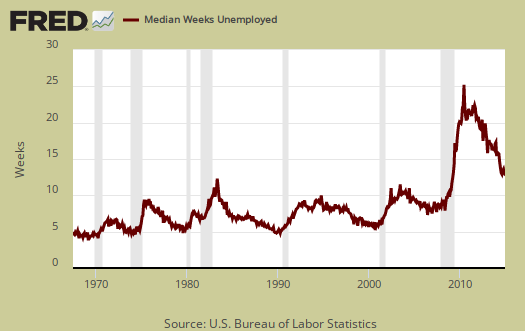
The median time one is unemployed, which means 50% of people have gotten a job in this amount of time is 12.6 weeks. A year ago this figure was 17 weeks, so finding job has greatly improved, but only for some. Still, over three months without work for half of the people looking is still a very long time, especially since most are living paycheck to paycheck and also get denied unemployment benefits.
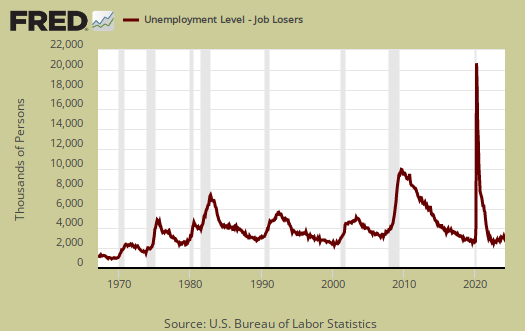
The household survey gives the reason for new unemployment status. Job losers and those who completed temporary jobsdecreased by -155,000 and stands at 4,325,000. Below is a graph of job losers by levels.
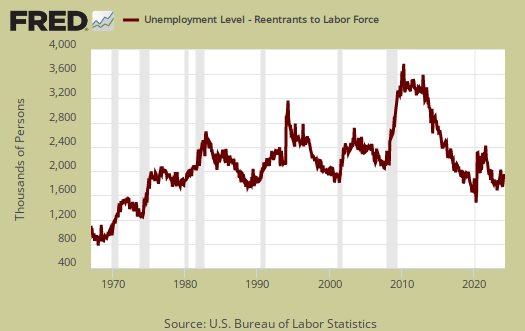
People join the ranks of the unemployed because they were laid-off, fired, they quit, the job was temporary and thus ended, they entered the labor force for the first time and re-entrants. Re-entrants are people with work experience, yet have been considered not in the labor force for some time. Recall to be considered unemployed one has to be actively searching for a job or expecting to be recalled and on temporary layoff. Re-entrants decreased by -60 thousand people this month to 2,701,000. Below are re-entrants as a percentage of the total unemployed. As you can see, as jobs and opportunities appear, people re-enter the labor force looking to snap one of those jobs. If there were really a lot of job opportunities out there, the slope of this graph would spike up.
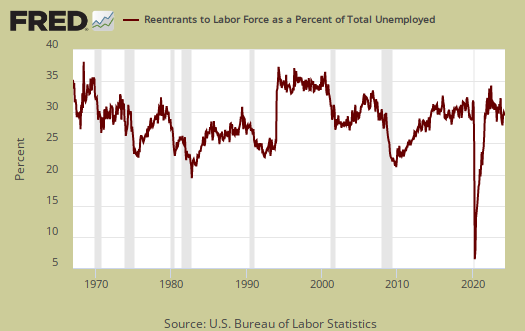
Re-entrant unemployed levels, graphed below, are yet another sign on how people are not finding work, giving up, then dropping out of the labor force and then trying again to get a job. If the job market was good for a long period we'd see this statistic drop as new entrants would have found work instead of being once again officially counted as unemployed.
This month's household survey shows some continuing trends that belie the reported payrolls growth. The labor participation rate stays at 38 year lows and those not in the labor force continue to grow past the the rate of retiring baby boomers. Here are our past overviews CPS unemployment statistics.
A Truly Healthy Economic Climate
In a truly healthy economic climate, an unemployment rate of 5.6% means that pretty-much everybody that wants to work is working. In a truly healthy economic climate, stocks are being purchased by our working middle-class; and corporations do't have to purchase their own stocks to keep their share prices falsely inflated. In a truly healthy economic climate, average people take vacations and save money for their future. In a truly healthy economic climate, the number of people on welfare, food stamps and disability doesn't increase each and every month. In a truly healthy economic climate, suicide rates don't quadruple within a six year period. Tear the wool off of your eyes and see the destruction of Obama and his Globalist handlers.
In a good economy...
It's not just the Democrats, it's the Republicans too. They're both getting up in front of God and Everybody and saying "America's broke.... We're running out of money"
Neat. How do you manage to accomplish that with a fully fiat currency? By telling people that the Federal Gov't has to "Balance the budget" instead of balancing the economy. And while I'm on the subject, how about this superstitious nonsense that we somehow have to "Pay back the National Debt"? Just up and give our savings back to the Federal Government? Why would you want to do that? To top it off, we have people in tin can costumes running around our nations campuses with their moronic "The Can Kicks Back" campaign, financed by corporations that have NO intention of giving up any of their hoard to "Pay back the National Debt".
It's a fully fiat currency that floats on the foreign exchange. There's nothing to "pay back". If it's a problem of not enough goods and services to go around, then we may need taxes to cool off the economy, but surely NOT while we're seeing numbers like Mr. Oak posted. Republicans - Shut up about cutting spending, Democrats - the next time you want to talk about raising taxes, put a sock in it! What we need is some combination of tax cuts and spending increases until we get the scenario outlined below:
"I just want to say a quick word about what a good economy is because it’s been so long since we’ve had a good economy. You’ve got to be at least as old as I am to remember it. In a good economy business competes for people. There is a shortage of people to work for business. Everybody wants to hire you. They’ll train you, whatever it takes. They hire students before they get out of school. You can change jobs if you want to because other companies are always trying to hire you. That’s the way the economy is supposed to be but that’s all turned around. For one reason, which I’ll keep coming back to, the budget deficit is too small. As soon as they started tightening up on budget deficits many years ago, we transformed from a good economy where the people were the most important thing to what I call this ‘crime against humanity’ that we have today." - W. Mosler
Unemployment rate
Here's what the author and other business reporters miss on labor participation. In 1990, according to the IRS, some $92 billion were earned by Americans "off the books" (or unreported.) Today that figure is $2.1 trillion, enough to nearly erase the annual deficit. What has happened is--because of the internet--large swaths of citizens take early retirement and then advertise their skills and services on places like Craigslist or through their own website and pick up an additional $20k or more on their own terms and not reporting it as income. That is why the economy's retail and restaurant sales are more indicative of a minus five percent unemployment rate. Since the IRS was forced to cut employees by 10,000 in the past three years, they can't enforce these scofflaws even if they wanted.
nice fantasy, no people are not getting rich off the books
Sorry, people are not getting rich off the books. Almost everywhere businesses report 1099-misc payouts. The underground economy is more with illegals and drugs, cash business which is not "the Internet".
People are hurting , the statistics are all over which show this to be true.
Mainstream media sugar-coats the headliners
International Business Times:
"Deep problems persist in the U.S. job market. Businesses are creating jobs, but many of them are part-time or temporary positions. At the same time, the number of people who are able to work but have dropped out of the workforce remains at a historically high level. And the portion of Americans considered to be long-term unemployed remains unusually high."
http://www.ibtimes.com/despite-falling-us-unemployment-numbers-long-term...