
The September ISM Manufacturing Survey shows PMI increased 0.5 percentage points to 56.2%. Seems the survey results are holding and PMI is now at the highest level for the year, although of course the latest Congressional economic sabotage through shutdown and debt ceiling hostage taking hasn't hit the manufacturing sector yet. New orders did slow but due to the previous past months of improvement, the employment index increased and is at it's highest level since July 2012.

The ISM manufacturing index is important due to manufacturing's economic multiplier effect. While manufacturing is about an eighth of the economy, it is of scale and spawns all sorts of additional economic growth surrounding the sector. This is a direct survey of manufacturers and every month ISM publishes some responder's comments. Most comments imply demand is increasing or flat. Increase in demand, comments such as work is picking up, is great news. We cannot recall when manufacturers reported increase demand in the comments. The comment which stood out was from computer and electronics manufacturing, and this is sad, very sad that squeezing labor has so much focus for this sector. Yet the comment does not imply good news for U.S. workers for assuredly U.S. manufacturers will simply try to find a worse country where labor gets even less wages than China.
Rising costs of China labor has us re-evaluating our current position in that country
Back to the index, new orders decreased -2.7 percentage points to 60.5%. This is still strong growth, the index is in the 60's, and new orders is coming off of last month's blow out increase, maintaining highs not seen since April 2011. Below is the correlation with the Census Bureau.
A New Orders Index above 52.3 percent, over time, is generally consistent with an increase in the Census Bureau's series on manufacturing orders.

The Census reported July durable goods new orders increased by 0.1%, where factory orders, or all of manufacturing data, will be out later this month, but note the one month lag from the ISM survey. The ISM claims the Census and their survey are consistent with each other. Below is a graph of manufacturing new orders percent change from one year ago (blue, scale on right), against ISM's manufacturing new orders index (maroon, scale on left) to the last release data available for the Census manufacturing statistics. Here we do see a consistent pattern between the two.

Below is the ISM table data, reprinted, for a quick view.
| ISM Manufacturing September 2013 | ||||||
|---|---|---|---|---|---|---|
| Index | September 2013 | August 2013 | % Change. | Direction | Rate of Change | Trend Months |
| PMI™ | 56.2 | 55.7 | +0.5 | Growing | Faster | 4 |
| New Orders | 60.5 | 63.2 | -2.7 | Growing | Slower | 4 |
| Production | 62.6 | 62.4 | +0.2 | Growing | Faster | 4 |
| Employment | 55.4 | 53.3 | +2.1 | Growing | Faster | 3 |
| Supplier Deliveries | 52.6 | 52.3 | +0.3 | Slowing | Faster | 3 |
| Inventories | 50.0 | 47.5 | +2.5 | Unchanged | From Contracting | 1 |
| Customers' Inventories | 43.0 | 42.5 | +0.5 | Too Low | Slower | 22 |
| Prices | 56.5 | 54.0 | +2.5 | Increasing | Faster | 2 |
| Backlog of Orders | 49.5 | 46.5 | +3.0 | Contracting | Slower | 5 |
| Exports | 52.0 | 55.5 | -3.5 | Growing | Slower | 10 |
| Imports | 55.0 | 58.0 | -3.0 | Growing | Slower | 8 |
| OVERALL ECONOMY | Growing | Faster | 52 | |||
| Manufacturing Sector | Growing | Faster | 4 | |||
Production, which is the current we're makin' stuff now meter, increased 0.2 percentage points from last month to 62.6% and is holding steady. Production usually follows incoming orders in the next month, although a production index in the 60's is strong growth. The last time the production index was consistently in the 60's was March 2011.

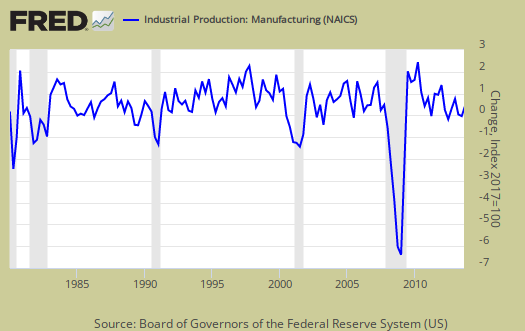
ISM's manufacturing production index loosely correlates to the Federal Reserve's industrial production, but not at 50% as the inflection point, instead 51.2% to indicate growth. Below is a graph of the ISM manufacturing production index (left, maroon), centered around the inflection point, quarterly average, against the Fed's manufacturing industrial production index's quarterly change (scale right, blue). We can see there is a matching pattern to the two different reports on manufacturing production.
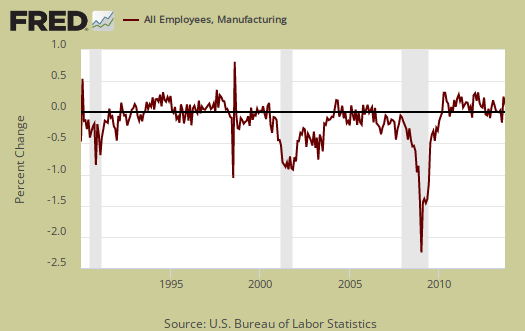
The manufacturing ISM employment index increased by 2.1 percentage points to 55.4%, which is growth. The neutral point for hiring vs. firing is 50.1%. Employment lags new orders and production, yet generally speaking it seems manufacturing employment just never gets off the ground and it would be wonderful to see this index go up to the 60's range, yet not so. Below are the BLS manufacturing non-farm payrolls (jobs) for the past decade on the left (maroon), graphed against the ISM manufacturing employment index on the right (blue). The BLS manufacturing payrolls is the monthly percentage change and the ISM manufacturing employment index is centered around it's inflection point of contraction and employment growth. This is just monthly change, manufacturing has lost approximately 5.8 million jobs over the graphed time period.
September saw inventories gain 2.5 percentage points to 50.0% and went from contraction to no change. As the economy is stagnant, businesses adjust inventories in response, which in turn impacts GDP. In December 2009 inventories came in at 41.9% for comparison's sake. This is actually good news for it implies manufacturer's believe demand maybe picking up for their products.
An Inventories Index greater than 42.7 percent, over time, is generally consistent with expansion in the Bureau of Economic Analysis' (BEA) figures on overall manufacturing inventories.

Supplier deliveries are how fast manufacturers can get their supplies. A value higher than 50 indicates slower delivery times, a value below 50 means the supply chain is speeding up. The index increased 0.3 percentage points to 52.6%, which means slower speed.

Order backlogs gained 3.0 percentage points to 49.5% which is still barely contraction, although the 5th month in a row. Backlogs of orders contraction generally is not good news. Less order backlogs would imply less production and less new employees to reduce backlogs, yet this also is a huge improvement over the last couple of months.

Imports decreased -0.3 percent points to 55.0% and and are in expansion for the 8th month in a row. Imports are materials from other countries manufacturers use to make their products and high levels isn't too great for economies of scale in the U.S. We want to see U.S. manufacturers use other U.S. manufactured materials instead of imports as much as possible.

New orders destined for export, or for customers outside of the United States decreased by -3.5 percentage point to 52.0% and is in expansion for the 10th month in a row. Previous to that there was half a year of contraction and generally speaking one doesn't want to see a slowing in exports from U.S. manufacturers, from a trade perspective as well as implications on global economic demand.

Prices increased another 2.5 percentage points to 56.5% which shows raw materials prices increased. Prices are yo-yo, up and down for the last five months, although this is the 2nd month in a row for an increase.

Customer's inventories increased by 0.5 percentage points to 43.0%. Below 50 means customer's inventories are considered by manufacturers to be too low and this is a dramatic decline for a monthly change in the index. Customer inventories, not to be confused with manufacturer's inventories, are how much customers have on hand, and rates the level of inventories the organization's customers have.

Here is the ISM industrial sector ordered list of growth and contraction. Chemical products always seems to be having a tough time of it and this month is no exception.
Of the 18 manufacturing industries, 11 are reporting growth in September in the following order: Electrical Equipment, Appliances & Components; Food, Beverage & Tobacco Products; Furniture & Related Products; Petroleum & Coal Products; Fabricated Metal Products; Paper Products; Printing & Related Support Activities; Transportation Equipment; Computer & Electronic Products; Machinery; and Plastics & Rubber Products. The six industries reporting contraction in September — listed in order — are: Apparel, Leather & Allied Products; Primary Metals; Textile Mills; Nonmetallic Mineral Products; Miscellaneous Manufacturing; and Chemical Products.
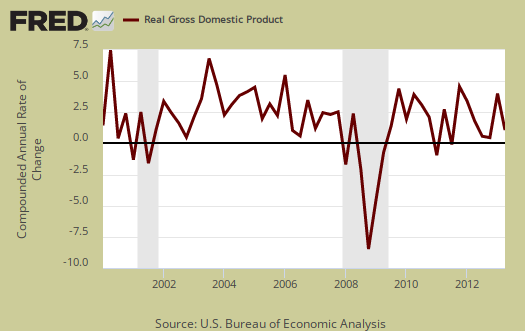
The ISM has a correlation formula to annualized real GDP, but they are now noting the past correlation, but note, PMI only has to be above 42.2% to indicate economic growth (right). Notice also that the PMI went to equal weighting in 2008. September's data, gives a 4.4% 2013 annual real GDP correlation and if PMI for the year is annualized, the implication is 3.3% annual real GDP growth. The below graph plots real GDP, left scale, against PMI, right scale, GDP up to Q2 2013. One needs to look at the pattern of the two lines to get anything out of this by quarters graph. If they match, GDP goes up, PMI goes up, would imply some correlation. Of all of the ISM's correlations, this is the one which consistently is way off, yet this is a high in terms of economic growth implications.
The ISM neutral point is 50, generally. Above is growth, below is contraction, There is some some variance in the individual indexes and their actual inflection points. For example, A manufacturing PMI above 42, over time, also indicates growth, even while manufacturing is in the dumpster. Here is last month's manufacturing ISM overview, unrevised. The ISM has much more data, tables, graphs and analysis on their website. For more graphs like the above, see St. Louis Federal Reserve Fred database and graphing system. PMI™ stands for purchasing manager's index. On ISM correlations to other indexes, when in dollars they normalized to 2000 values. The above graphs do not do that, so our graphs are much more rough than what the ISM reports these indices track.
Note: The ISM is seasonally adjusting some of these indexes and not others due to the criteria for seasonal adjustment. Those indexes not seasonally adjusted are: Inventories, Customers' Inventories, Prices, Backlog of Orders, New Export Orders and Imports.
Recent comments