
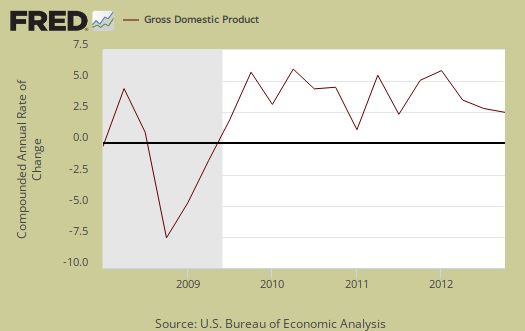
Q4 2012 real GDP grew by just 0.1% after the second revision.. While technically not in contraction, 4th quarter gross domestic product results imply the economy was officially D.O.A. Trade imports plunged, which helped economic growth. Exports were also significantly revised upward. Inventory investment nose dived and was revised downward significantly. Government spending cliff dove and sucked out -1.38 percentage points from 4th quarter real gross domestic product growth as federal defense spending declined 22.0% from Q3. Private inventory changes hacked off -1.55 percentage points from Q4 real GDP as businesses shed their inventories. Even without inventories in the economic growth mix, the economy is suffering from weak demand.

Consumer spending was breathing in Q4 with a +1.52 percentage point contribution. Consumer spending, driven by durable goods purchases, seems like a bright spot, but that's actually low by percentage points, even though consumer spending did increase from Q3. Real imports contracted more than realized and thus increased Q4 GDP.
As a reminder, GDP is made up of: where Y=GDP, C=Consumption, I=Investment, G=Government Spending, (X-M)=Net Exports, X=Exports, M=Imports*.
The below table shows the percentage point spread breakdown from Q3 to Q4 GDP major components. GDP percentage point component contributions are calculated individually.
| Comparison of Q3 2012 and Q4 2012 GDP Components | |||
|---|---|---|---|
|
Component |
Q3 2012 |
Q4 2012 |
Spread |
| GDP | +3.10 | +0.13 | -2.97 |
| C | +1.12 | +1.47 | +0.35 |
| I | +0.85 | –0.20 | -1.05 |
| G | +0.75 | –1.38 | -2.13 |
| X | +0.27 | –0.55 | -0.82 |
| M | +0.11 | +0.79 | +0.68 |
This next table compares the change in Q4 revisions from the real GDP percentage point contribution spread perspective.
| Comparison of Q4 2012 GDP Component Revisions | |||
|---|---|---|---|
|
Component |
Q4 2012, 2nd Revision |
Q4 2012, Advance |
Spread |
| GDP | +0.13 | -0.14 | +0.27 |
| C | +1.47 | +1.52 | -0.05 |
| I | –0.20 | –0.08 | -0.12 |
| G | –1.38 | –1.33 | -0.05 |
| X | –0.55 | –0.81 | +0.26 |
| M | +0.79 | +0.56 | +0.23 |
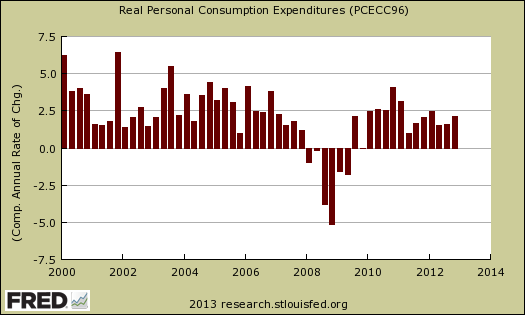
Consumer spending, C in our GDP equation, showed an increase from Q3. Durable goods consumer spending drove the rise, with a 1.03 percentage points to personal consumption expenditures. In terms of percentage changes, real consumer spending increased 2.1% in Q4 in comparison to a 1.6% increase in Q3. Below is a percentage change graph in real consumer spending going back to 2000 to show Q4 consumer spending is nothing to write home about.
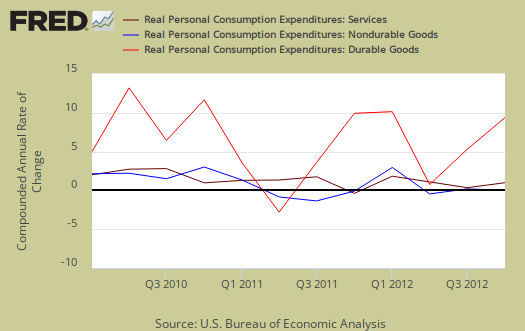
Within personal consumption expenditures, motor vehicles & parts alone was a 0.53 percentage point contribution and recreational goods & vehicles added 0.26 percentage points. Services spending shows a 0.44 percentage point contribution to real GDP, yet housing and utilities subtracted –0.54 percentage points. These values have been adjusted for inflation so one cannot blame falling energy prices or decreased rent. Graphed below is PCE with the quarterly annualized percentage change breakdown of durable goods (red or bright red), nondurable goods (blue) versus services (maroon).
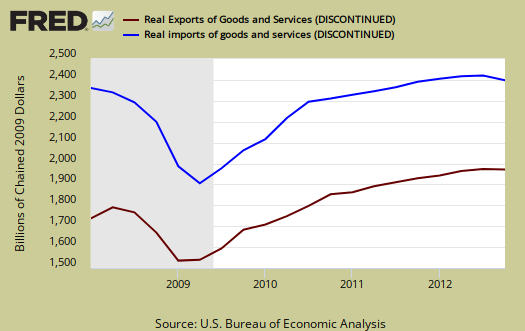
Imports and Exports, M & X are greatly revised as expected from December's trade deficit plunge. Exports grew more than previously estimated but imports imploded, which helped the U.S. economy. The below graph shows real imports vs. exports in billions. The break down of the GDP percentage change to point contributions gives a clear picture on how much the trade deficit stunts U.S. economic growth.
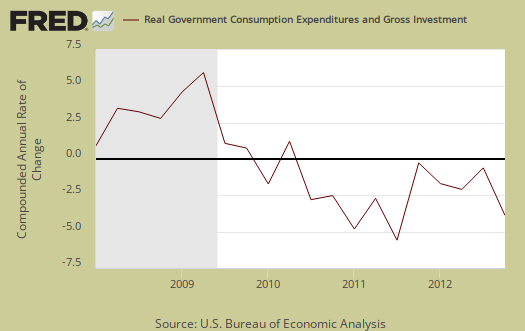
Government spending, G was -1.38 percentage points of Q4's meager +0.13% GDP. This was all federal spending, and of that Federal –1.23 percentage point GDP contribution, –1.28 of it was national defense. The decline in defense spending is not a one time thing as budget cuts for the department of defense have already been announced. State and local governments subtracted -0.15 percentage points from Q4 GDP. Local and state governments are still hurting and contracting in their expenditures. Below is the percentage quarterly change of government spending, adjusted for prices, annualized.
Investment, I is made up of fixed investment and changes to private inventories. The change in private inventories alone gave a –1.55 percentage point contribution to Q4 GDP. That is -0.28 downward percentage point contribution revision. Below are the change in real private inventories and the next graph is the change in that value from the previous quarter.


This was businesses contracting their inventories, and that's a really bad sign on how much demand they see for their products in the future. Non-farm changes in inventories hacked off –1.70 percentage points from Q4 GDP growth and this reducing inventories on hand for industry can be blamed for D.O.A. economic growth. The drought is over as farm inventories added 0.15 percentage points to real GDP.
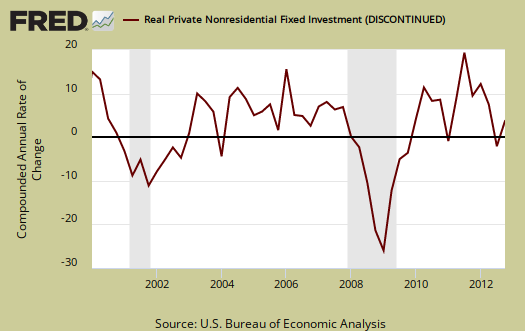
Fixed investment is residential and nonresidential and is a another bright spot in the Q4 GDP report. Overall, fixed investment contributed +1.36 percentage points to GDP. Residential fixed investment was +0.40 percentage point contribution to Q4 GDP. One can see the housing bubble collapse in the below graph and also how there is no meteoric recovery for Q4, in spite of all of the housing data hype. Residential real estate is adding to economic growth, but it is not the bubble years econmic driver some are claiming. That's a good thing, after all, bubble economies eventually pop.

Nonresidential fixed investment was even better and gave a +0.96 percentage point contribution to Q4 real GDP. Equipment and software was a +0.79 GDP percentage point contribution while structures added 0.16 percentage points to real GDP.
Motor Vehicles as a whole, as output, was 0.19 percentage points of Q4 real GDP. Computer final sales, contributed to GDP by 0.10 percentage points. These categories are different from personal consumption, or C sub-components, such as auto & parts. These are overall separate indices to show how much they added to GDP overall. Motor vehicles, computers are bought as investment, as fleets, in bulk, by the government, as well as part of consumer spending, government spending and so on.
Overall, services slammed GDP with a -0.72 percentage point contribution while goods, overall added +0.34 percentage points. Structures, overall, which is building activity, both residential and commercial and economic activity it generates, contributed +0.51 percentage points to Q4 real GDP.
The price index for gross domestic purchases, was 1.5% for Q4 in comparison to 1.4% for Q3. This means there was inflation was on par with last quarter. Also, the price index was revised upward by 0.2 percentage points. Since the price index is used to remove inflation from GDP to obtain real growth, it seems we had more price increases than real economic activity than previously thought in Q4. Core price index, or prices excluding food and energy products, was 1.1% .
Nominal GDP: In current dollars, not adjusted for prices, Q4 GDP, or the U.S. output, is $15,851.2 billion, an 1.0% increase from Q3's $15.811 trillion. Q3 saw a 5.9% increase in nominal GDP. Applying the price indexes, or chained, real 2005 dollars, Q4 2012 GDP was $13.,659 trillion. All figures are annualized.
Gross domestic purchases are what U.S. consumers bought no matter whether it was made in Ohio or China. It's defined as GDP plus imports and minus exports or using our above equation: where P = Real gross domestic purchases. Real gross domestic purchases contracted -0.1% in Q4 in comparison to a 2.6% increase in Q3. Exports are subtracted off because they are outta here, you can't buy 'em, but imports, as well a know all too well, are available for purchase at your local Walmart. When gross domestic purchases exceed GDP, that's actually bad news, it means America is buying imports instead of goods made domestically or not buying much at all.
Real final sales of domestic product is GDP - inventories change. This gives a better feel for real demand in the economy. This is because while private inventories represent economic activity, the stuff is sitting on the shelf, it's not demanded or sold. Real final sales increased 1.7% for Q4, which reflects weak demand, even though it was revied upward from 1.1% in the advance GDP estimate. Q3 real final sales increased 2.4%.

Below are the percentage changes of Q4 2012 GDP components, from Q3. There is a difference between percentage change and percentage point change. Point change adds up to the total GDP percentage change and is reported above. The below is the individual quarterly percentage change, against themselves, of each component which makes up overall GDP. Additionally these changes are seasonally adjusted and reported by the BEA in annualized format.
|
Q4 2012 Component Percentage Change (annualized) |
|||
|---|---|---|---|
| Component | Percentage Change from Q3 | ||
| GDP | +0.1% | ||
| C | +2.1% | ||
| I | –1.5% | ||
| G | –6.9% | ||
| X | –3.9% | ||
| M | –4.5% | ||
The BEA's comparisons in percentage change breakdown of 4th quarter GDP components are below. Changes to private inventories is a component of I.
C: Real personal consumption expenditures increased 2.1 percent in the fourth quarter, compared with an increase of 1.6 percent in the third. Durable goods increased 13.8 percent, compared with an increase of 8.9 percent. Nondurable goods increased 0.1 percent, compared with an increase of 1.2 percent. Services increased 0.9 percent, compared with an increase of 0.6 percent.
I: Real nonresidential fixed investment increased 9.7 percent in the fourth quarter, in contrast to a decrease of 1.8 percent in the third. Nonresidential structures increased 5.8 percent; it was unchanged in the third quarter. Equipment and software increased 11.3 percent in the fourth quarter, in contrast to a decrease of 2.6 percent in the third. Real residential fixed investment increased 17.5 percent, compared with an increase of 13.5 percent.
X & M: Real exports of goods and services decreased 3.9 percent in the fourth quarter, in contrast to an increase of 1.9 percent in the third. Real imports of goods and services decreased 4.5 percent, compared with a decrease of 0.6 percent.
G: Real federal government consumption expenditures and gross investment decreased 14.8 percent in the fourth quarter, in contrast to an increase of 9.5 percent in the third. National defense decreased 22.0 percent, in contrast to an increase of 12.9 percent. Nondefense increased 1.8 percent, compared with an increase of 3.0 percent. Real state and local government consumption expenditures and gross investment decreased 1.3 percent, in contrast to an increase of 0.3 percent.
Here is our overview for Q3 GDP previous estimate, here is the overview for Q4 GDP advance report. Other reports on gross domestic product can be found here.
Q4 GDP Apologists abound
After number crunching our overviews, I often read the main stream media's take, or lack thereof.
I'm seeing apologists trying to claim Q4 and Q3 GDP are pretty much the same. Uh, no, they are not. Just because inventories increased 0.73 percentage points in Q3 does not negate Q4's -1.55 percentage point plunge. Anyway you slice it, that's bad news and anyone claiming consumer spending is so hot is also not in historical reality. Think about the fact there are more people in the United States, and while GDP is adjusted for inflation, it is not presented per capita.
Finally, the cuts to defense spending, all services, are a shadow of what is about to happen due to Congressional ineptitude.
While there is clearly investment and spending happening, there simply is not enough demand in the economy.
Bottom line, it sure looks like the biggest drag on the economy is Congress and that isn't going to change anytime soon.
Years from now they will admit we were in a recession for years
Years from now the obvious will be stated - there was no recovery. And now with consumers disappearing as people can't buy anything as more and more jobs are destroyed/lost, the people in entire sectors will find that there are only so many Lear Jets and Tiffany rings the 1% can buy and it really does matter if 99% of the population don't have living wage jobs. HR, marketing, sales, real estate agents, health (because the unemployed and poor don't visit doctors or buy needed medications) will all suffer and will be among the people they viewed as somehow being damaged because they were "unemployed." US Government and 1%er talking points - meet reality, we've been here awhile, welcome to the club. And when more and more people can't buy goods and services and join the ever-growing unemployed ranks, they too will start railing against Bill "The Unemployed are all Lazy Bums" O'Reilly and MSNBC "Green Shoots are Everywhere" and start to question the American Dream and corporate government.
There is no recovery, it never started. We're in a Depression, both economic and far worse, a deeply social/political one that is tearing this country apart and destroying American citizens all in the name of money and power by a small group of people and companies. The groundwork was laid years ago in free trade and financial deregulation. Their puppets will join the unemployed and suffering, and then the fun really begins.
Okun's law, technically we are not in a recession
A recession is defined as two consecutive quarters of contracting real GDP. That said, it's very clear increased productivity, economic growth is not translating to the U.S. worker.
Okun's Law is basically a ratio of the unemployment rate to GDP, but it is potential GDP, not actual.
I did a graph of it here and am looking to do a big picture annual GDP to employment to wages type of article soon.
Beyond the fact that the U.S. is not generating enough economic growth to really create jobs, there is another element which I think is completely ignored by not just politicians but most economists. That's globalization. It's pretty clear with India having outsourcing be such a large part of their GDP, plus the employment levels in both India and China, foreign workers being the growth "area" for actual U.S. employment, this is really hurting the U.S. worker.
That said, technically we are not in a recession, although I think it is highly probable at this point Congress will throw the U.S. back into a recession.
I think for anyone to be elected to Congress, they should be required to pass a basic economics test as well as a basic math test. See the overview of Bernanke's testimony where it is a true horror to watch these people. That's what is wrong, we cannot even get basic economic theory recognized by way too many of these politicians. How can one legislate when they cannot even get basic laws of supply and demand through their thick skulls?
Congress Really?
The House of Representatives has proposed budgets for the last 2 years & sent them to the Senate for a vote. Senator Harry Reid refuses to have vote.
Meanwhile The Democrat Party has yet to formally propose a budget.
"Think about the fact there are more people in the United States, and while GDP is adjusted for inflation, it is not presented per capita." that comment is the truth.
But Obama has no responsibility here? Really?
We do not care who is to blame
Over time, Congressional leaders, Obama are proposing insane economics. It just happens to be the latest insanity is Congress. They push lobbyist written corporate favors and are hell bent in further middle class destruction.
It does not matter who is to blame for they all are and now they are sending the economy into the tank over their absurd politics which demand they harm the U.S. economy. EOM.